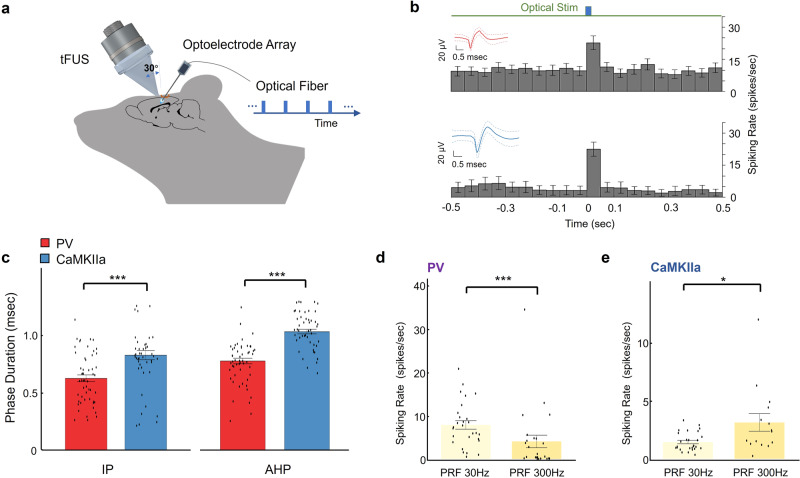
Fig. 7. Validation of PRF preferences of inhibitory and excitatory neurons.
a A mouse-specific 3D-printed collimator guiding tFUS to hair-removed scalp of an anesthetized transgenic mouse model (2% isoflurane, 2 mg/kg bupivacaine subcutaneously) with an incidence angle of 30°, and a 32-channel optoelectrode array inserted at another incidence angle of 40° into the left S1 prepared through a craniotomy. The blue light stimuli were pulsed using a PlexBright LD-1 Single-Channel LED driver at 30 mA and were then delivered via optical fiber (105 μm diameter) to the recoding side of the shank. b The PSTHs (bin size: 50 ms) of one PV spiking unit (upper panel, 258 trials for each time bin, IP duration mean: 550 μs; AHP duration mean: 850 μs) and one CaMKIIa spiking unit (lower panel, 128 trials for each time bin, IP duration mean: 600 μs; AHP duration mean: 1100 μs) responding to the optical stimuli. Spike waveforms depicted as insets in b, solid red line as the mean waveform, dashed lines as the waveform standard deviation. Data are shown in the PSTHs as the mean ± 95% confidence interval. c Comparing PV (n = 53) and CaMKIIa (n = 50) neurons regarding the IP (PV vs. CaMKIIa: p = 6 × 10⁻⁵) and AHP (PV vs. CaMKIIa: p = 3 × 10⁻¹²) phase durations. Data are shown as the mean±s.e.m., statistics by one-tail Wilcoxon test. ***p < 0.001. d, e The comparisons of spiking rates between the tFUS conditions of PRF 30 Hz (n = 28 for PV neurons, n = 27 for CaMKIIa neurons) and PRF 300 Hz (n = 25 for PV neurons, n = 15 for CaMKIIa neurons) on PV (d) (PRF 30 Hz vs. PRF 300 Hz: p = 2 × 10⁻⁴) and CaMKIIa (e) (PRF 30 Hz vs. PRF 300 Hz: p = 0.016) neurons, respectively. Data are shown as the mean±s.e.m., statistics by two-tail Wilcoxon test. *p < 0.05, ***p < 0.001. Source data are provided in the Source Data file.

