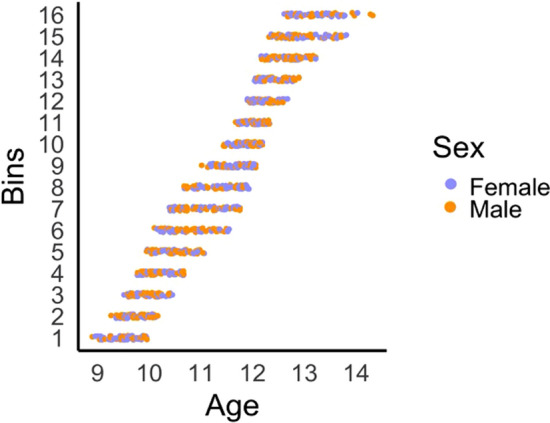
Figure 1.

Illustration of 16 age-bins for the sliding window configuration with a bin size of 80 and step of 25%. The number of age-bins varied between 12 and 23 across the 9 sliding window configurations. Structural covariance networks (adjusted for sex, cohort, scanner) were created for each age-bin, and the median age was assigned to each network. Individual scans contributed to multiple age bins, but only one scan per participant was included in each bin.
