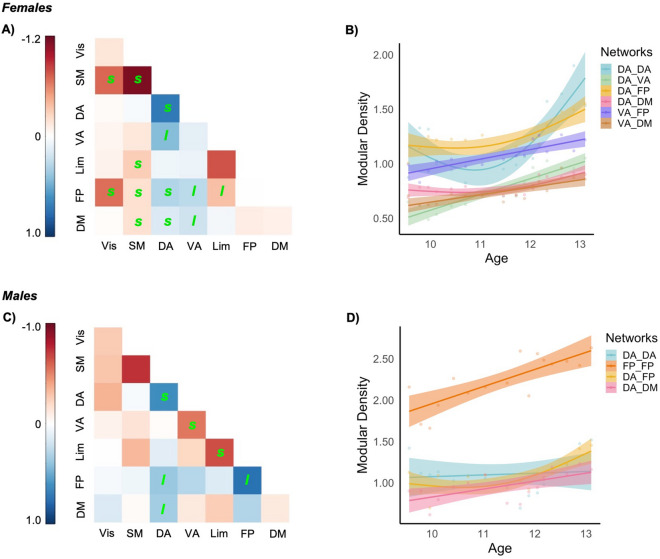
Figure 5.
Change in “normalized” density of connections between and within networks in females (A) and males (C); l and s indicate significant linear and nonlinear (smooth) trajectories, respectively. Effect size is the difference between maximum and minimum density relative to minimum density for the sliding window size of 80 and step of 25%. Significant developmental trajectories of certain networks illustrated in females (B) and males (D), also illustrated for the sliding window size of 80 and step of 25%. DA dorsal attention, DM default model, FP frontoparietal, Lim limbic, VA ventral attention, Vis visual.

