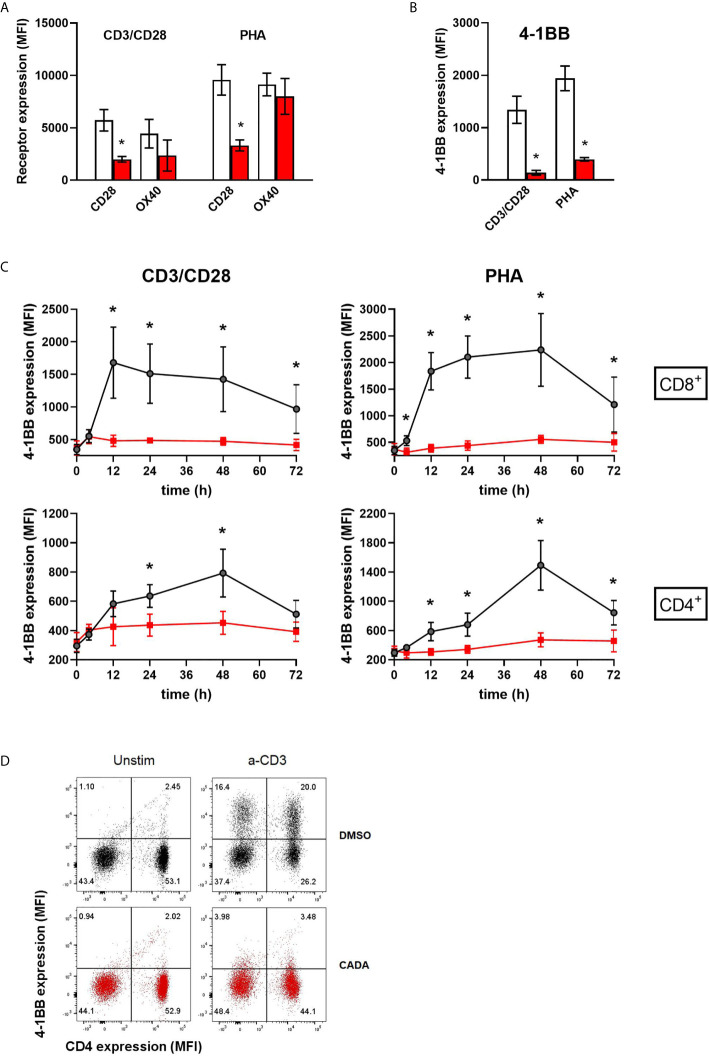
Figure 6.
CADA strongly suppresses the upregulation of the co-stimulatory molecule 4-1BB in activated PBMCs. (A, B) PBMCs were pre-incubated with CADA (10 μM) or DMSO for 3 days, after which they were activated by CD3/CD28 beads or PHA. Cell surface CD28 expression was measured on gated CD4+ T cells by flow cytometry on d3 post activation. Cell surface expression of OX40 and 4‑1BB was measured on total PBMCs by flow cytometry on d2 post activation. Bar diagrams are showing the MFI for the indicated receptor, with DMSO in white and CADA in red. Paired t-tests were performed to compare CADA to DMSO with *p<0.05. Values represent mean ± SD of four different donors (n=4). (C) PBMCs were pre-incubated with CADA (10 μM) or DMSO for 3 days, after which they were activated by CD3/CD28 beads or PHA. Cell surface 4‑1BB expression was measured on gated CD4+ and CD8+ T cells by flow cytometry on the indicated time points post activation. Multiple t-tests were performed to compare CADA to DMSO for each condition with *p<0.05 and with Holm-Sidak method as correction for multiple comparison. Curves are showing mean values ± SD of six different donors (n=6). (D) PBMCs were pre-incubated with CADA (10 μM) or DMSO for 2 hours, and subsequently activated by anti-CD3 antibodies only. Cell surface CD4 and 4‑1BB expression was measured by flow cytometry at 24h post activation. Representative dot plots for CD4 and 4‑1 BB double staining are shown for unstimulated and stimulated cells. Do note that this short CADA-treatment has neglectible effect on the CD4 expression in unstimulated cells (see lower right quadrants), but blocks the expression of 4‑1BB in activated cells, both in CD4 negative (upper left quadrant) and CD4 positive cells (upper right quadrant). See also Supplementary Figure 6 .

