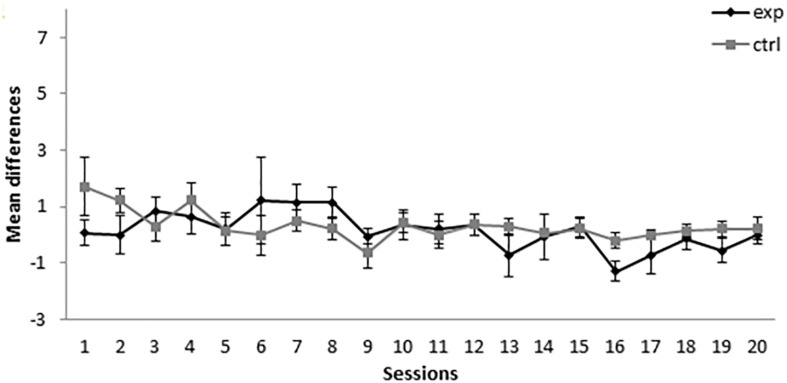
FIGURE 5.
Conditioning phase in Experiment 3. PreX-X differences (±SEM), averaged for the two X− presentations per session in conditioning, are displayed. The black line represents the group that was trained with five A+, 11 AX−, three F−, nine F+, and two X− presentations per session in conditioning. The gray line represents the group that was trained with five A+, 11 BX−, three F−, nine F+, and two X− presentations per session.

