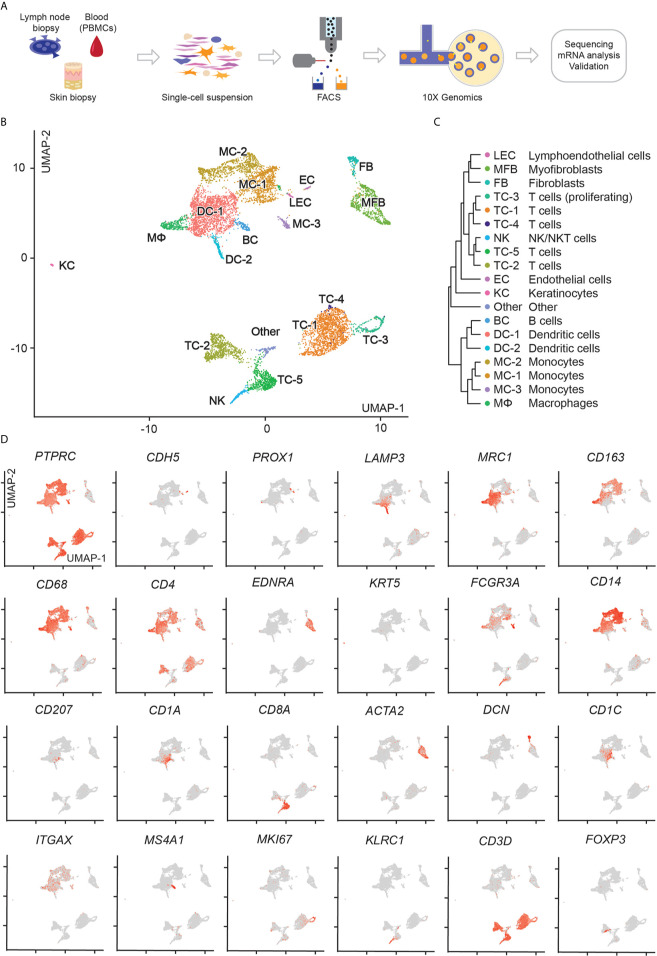
Figure 2.
scRNA-seq workflow and map of isolated cells from lymph node, blood, and skin. (A) Outline of steps for single cell profiling of trancriptomes from different tissues. (B) UMAP of 9,028 cells integrated from lymph node (1,215), blood (3,301), and skin (4,512) samples according to similarity of their transcriptome, resulting in 19 different color-coded clusters. (C) Unsupervised hierarchical clustering showing relatedness of cell clusters (average gene signatures; correlation distance metric and average linkage). (D) Combined feature plots of all samples showing expression distribution for canonical markers. Intensity of normalized expression for each cell is color-coded (red) and overlaid onto UMAP plots.

