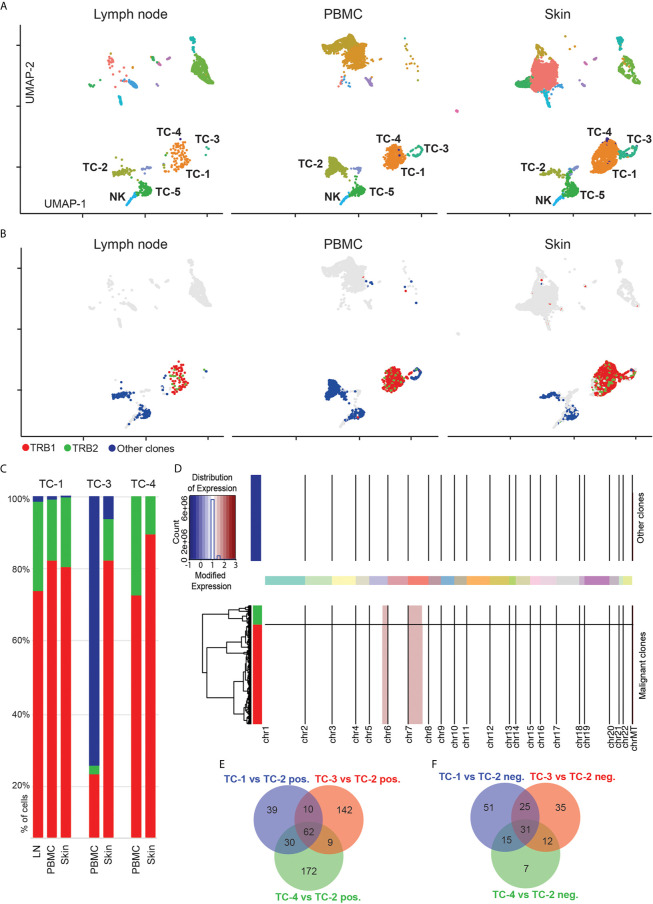
Figure 3.
Expansion of two similar T-cell clones in blood, lymph node and skin. (A) Separate UMAP plots of lymph node, blood and skin samples; numbers refer to respective cell clusters. (B) Cells with detectable T-cell receptor are colored; cells without detectable T-cell receptor are displayed in grey. TCR+ polyclonal cells are labelled in blue, while the two top expanded clones are labelled in red and green, respectively. Data overlaid onto UMAP plots separately for each tissue. (C) Frequencies of most common clonotypes (red, green) and the polyclonal T-cell infiltrate (blue) in T-cell clusters TC-1, TC-3 and TC-4. (D) Copy number variation (CNV) analysis: Chromosomes are given on x-axis, and y-axis is proportional to cell numbers. Red indicates chromosomal gains. Dendrogram legend red is clonotype TRB1 and green TRB2. (E, F) Venn diagram of significantly up- and downregulated genes comparing tumor clusters TC-1, TC-3 and TC-4 with benign CD4+ T-helper cells from cluster TC-2 (adjusted p value<0.05, logFC>|0.5|). UMAP: Uniform Manifold Approximation and Projection; PBMC: Peripheral blood mononuclear cells.

