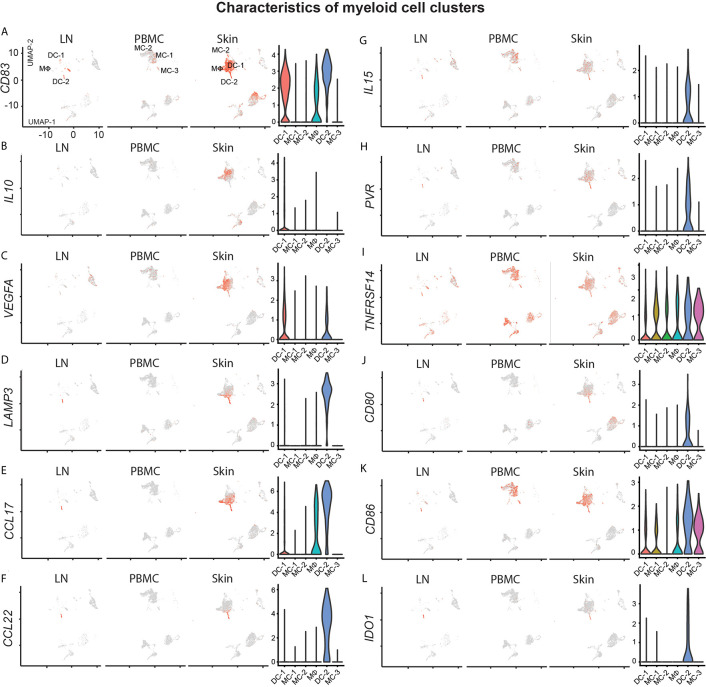
Figure 5.
Characterization of myeloid cell clusters. (A–L) For feature plots, normalized expression levels for each cell are color-coded (red) and overlaid onto separate UMAP plots for lymph node (LN), blood (PBMC) and skin. Intensity of color reflects respective level of expression. Violin plots of the combined samples show the distribution of normalized gene expression levels of the respective genes in color-coded DC-1, MC-1, MC-2, MΦ, DC-2 and MC-3 clusters.

