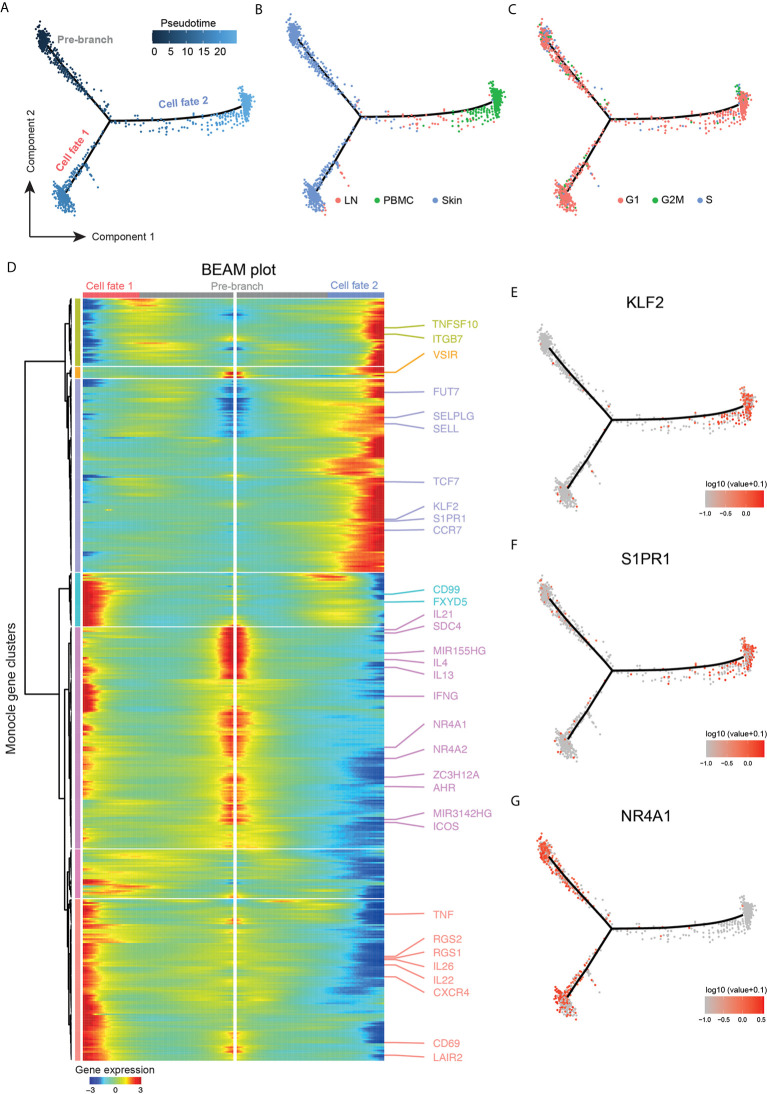
Figure 6.
Trajectory analysis highlighting tumor clone plasticity throughout body compartments. (A) Pseudotime ordering of malignant cells from clusters TC-1 and TC-3 along a bifurcated cell trajectory. Plot colored according to pseudotime. (B) Trajectory plot colored according to tissue of origin in red (LN: lymph node), green (PBMC, peripheral blood mononuclear cells), and blue (skin). (C) Trajectory plot colored according cell cycle phase in red (G1), green (G2/M) and blue (S). (D) Bifurcated expression heat map of genes for bifurcation between cell fates 1 and 2. Middle of heat map shows pre-branch cells, left side the expression of cells from “cell fate 1”, and right side the expression blood-oriented cells (“cell fate 2”). (E–G) Trajectory plots with overlaid expression of respective genes, highest expression in red, lowest expression in grey.

