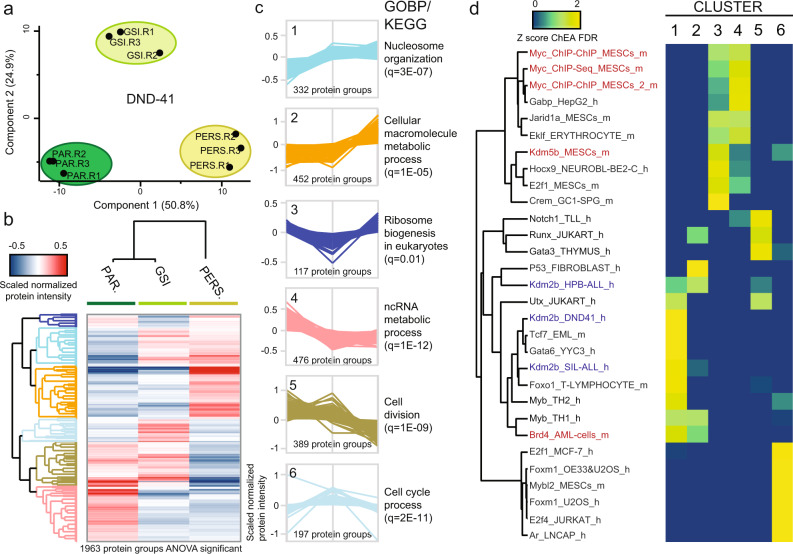
Fig. 3. Proteomics analysis of drug-tolerant persister DND-41 cells.
a Principal component analysis (PCA) of all quantified proteins. b Hierarchical clustering of normalized protein intensities scaled per replicate (columns: Pearson correlation; rows: Canberra distance) for significantly regulated proteins among conditions (one-way ANOVA: Benjamini–Hochberg FDR = 0.01; s0 = 0.1; n = 3 biologically independent samples). The mean for each protein per condition is shown. c Protein expression profiles for each cluster are shown on the left. The most enriched gene ontology term per cluster is shown on the right side of each profile. Enrichment analysis was performed in Perseus using all regulated proteins per cluster (background: proteome). d Regulated proteins were ranked based on the log2 fold-change Persister/Parental (Cluster 1–2 and 4–5) or Persister/GSI (Cluster 3 and 6) and ChIP enrichment analysis (ChEA) was performed with the top-100 through Enrichr. The −log10 of the Benjamini–Hochberg corrected p values (FDR) are Z-score normalized and the results are shown in a heatmap. PAR parental, PERS persister, GOBP gene ontology biological processes, q Benjamini–Hochberg-corrected p value, h human, m murine. Source data are provided as Source Data file.

