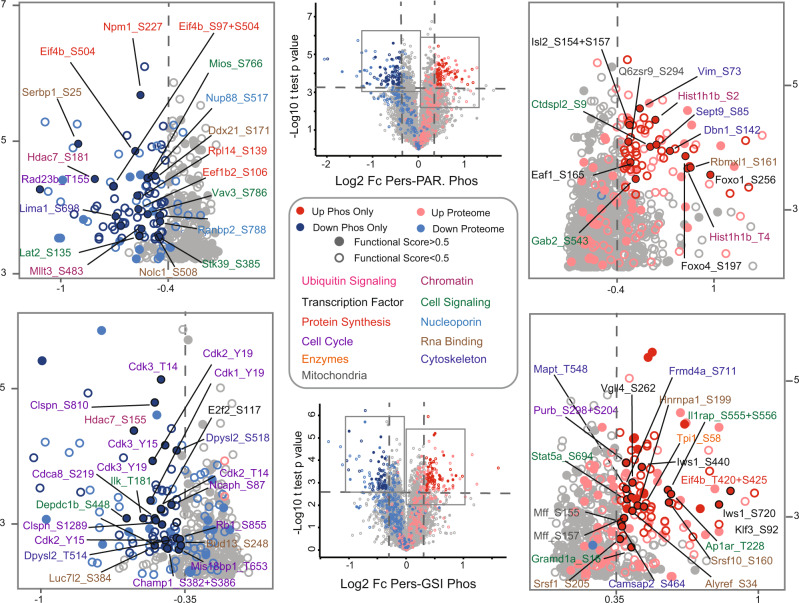
Fig. 4. Phosphoproteomics analysis of drug-tolerant persister DND-41 cells.
Volcano plot analysis for the Persister/Parental (upper part) and Persister/GSI (lower part) comparisons. Significance was determined through unpaired two-sided t test (Benjamini–Hochberg FDR < 0.01 for Persister/Parental and <0.05 for Persister/GSI; n = 3 biologically independent experiments). For significance analysis, a threshold on the Log2 fold-change was applied, equal to three times standard deviation, which was calculated on all sites, separately for up and downregulated ones. The annotated plots are magnified sections of the volcano plots in the middle. Phosphosites whose corresponding proteins are regulated on the proteome level, using the same criteria applied to the phosphoproteome, are marked in pink (upregulated) and light blue (downregulated). Phosphosites with a functional score >0.5 are represented as filled circles. Only significantly regulated sites with functional scores >0.5 and not regulated on the proteome level are labeled. In the Pers/GSI comparison, shared regulated sites between comparisons are not labeled. The color name indicates the biological process the corresponding protein is involved.

