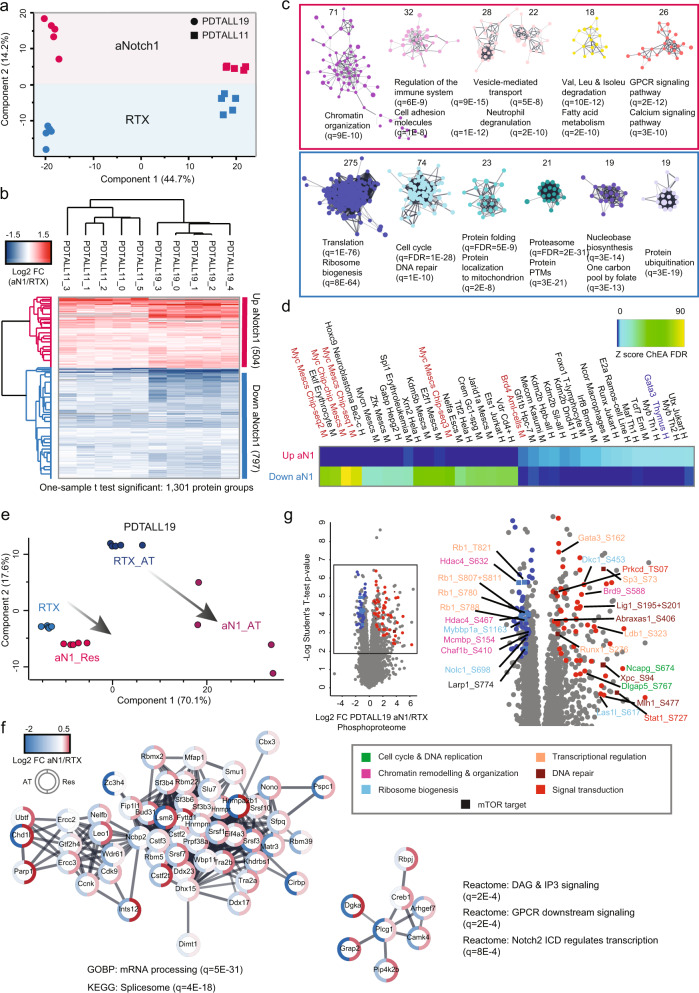
Fig. 5. Proteomics and phosphoproteomics analysis of T-ALL PDXs resistant to the anti-Notch1 monoclonal antibody OMP52M51.
a Principal component analysis of all proteins quantified in at least three mice per group. b Unsupervised hierarchical clustering of log2 fold-change anti-Notch1/Rituximab for significantly regulated proteins among conditions (one-sample t test: Benjamini–Hochberg FDR < 0.01; s0 = 0.1; n = 9 biologically independent mice). Columns: Pearson correlation; rows: Canberra distance. The median for RTX was used to calculate the log2 fold-change. c Functional STRING network of significantly regulated proteins represented in b (cutoff: log2 fold-change >2-time standard deviation), generated through the stringApp. Clusters were generated by MCL clustering through the Clustermaker2 app. Gene ontology enrichment analysis was performed through the stringApp. Only the six biggest clusters are shown. Background: proteome. d ChIP enrichment analysis (ChEA) was performed on significantly regulated proteins represented in b (cutoff: log2 fold-change >2-time standard deviation). The −log10 of the Benjamini–Hochberg corrected p values (FDR) are Z-score normalized and the results are shown in a heatmap. e Principal component analysis of proteins significantly regulated in the PDTALL19 model, both in the antiNotch1 acute treatment (AT) and resistance (Res) (unpaired two-sided t test: permutation-based FDR < 0.05; n = 5 or 4, respectively). f Functional STRING network of proteins whose expression was upregulated in the resistance and downregulated in the acute treatment (belonging to the pink cluster in Supplementary Fig. 6d). The network was generated through the Omics visualizer app. g Volcano plot analysis for the aNotch1/Rituximab comparison in the PDTALL19 phophoproteome. Significance was determined through a SAM test (unpaired two-sided t test: permutation-based FDR < 0.01; s0 = 0.1; n = 5). Only a selection of phosphosites with functional scores >0.5 is labeled. Color name indicates the biological processes associated with the corresponding protein. RTX control antibody Rituximab, aNotch1 or aN1 anti-Notch1, FC fold-change, h human, m murine, q Benjamini–Hochberg-corrected p value. Source data are provided as Source Data file.

