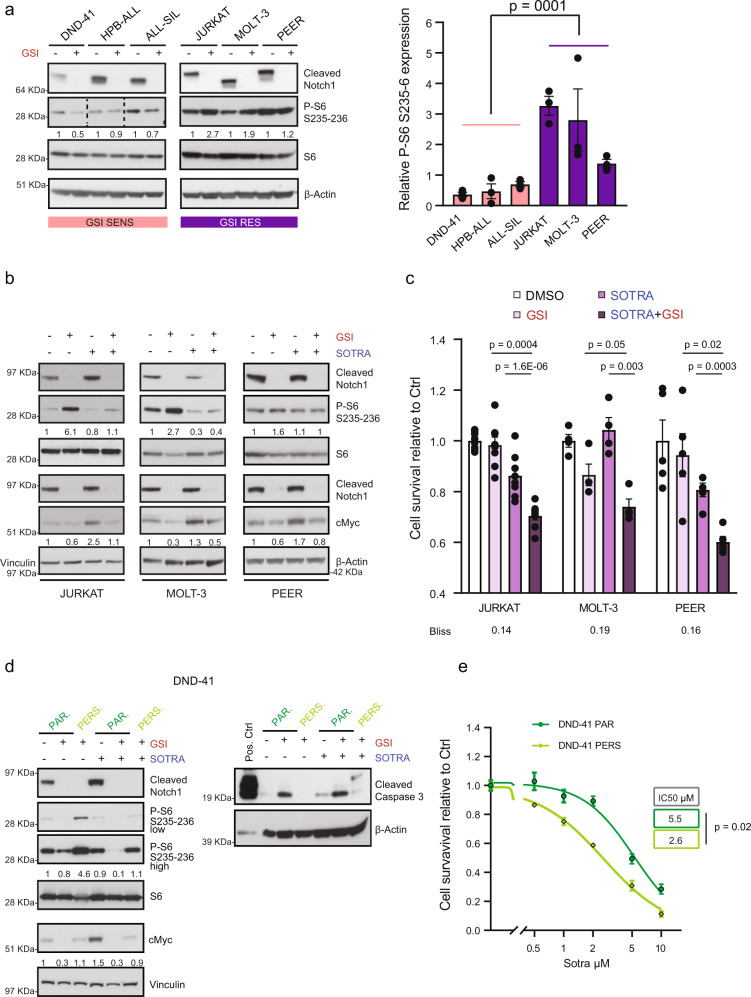
Fig. 7. Combination treatment targeting Notch and PKC in cells resistant to NOTCHi.
a Cells were treated for 5 days with GSI (0.5 μM) and the lysates were immunoblotted for the indicated antibodies. HPB-ALL samples: higher exposure time. The values shown in the right panel are mean ± SEM (n = 3 biologically independent samples per cell line). An unpaired two-sided t test was used to assess the differences in mean protein expression (n = 9 biologically independent samples examined over 3 independent experiments). b Cells were treated with GSI (0.5 μM), sotrastaurin (5 μM) or the combination, and the lysates were immunoblotted for the indicated antibodies. P-S6 and S6: 3 days of treatment; cMyc: 5 days of treatment. JURKAT: the blot is representative of 3 (cMyc) or 4 (S6) independent experiments. MOLT-3/S6: n = 2. MOLT-3/cMyc and PEER: n = 1. c Cells were treated for 6 days with GSI (0.5 μM), sotrastaurin (5 μM) or the combination, and they were assayed for cell survival by CCK8 assay. The values shown are mean ± SEM (JURKAT: n = 8 biologically independent samples examined over 4 independent experiments; MOLT-3 and PEER: n = 4 biologically independent samples examined over two independent experiments). An unpaired two-sided t test was used to assess the differences in mean survival. Bliss >0 synergy; <0 antagonism; =0 additive effect. d Parental and persister DND-41 cells were treated for 5 days with GSI (0.5 μM), sotrastaurin (5 μM) or the combination, and the lysates were immunoblotted for the indicated antibodies (left blot is representative of n = 3 biologically independent experiments; right blot of n = 2). e Cell survival assay of parental and persister DND-41 cells in response to increasing doses of sotrastaurin (5 μM) for 6 days. The values shown are mean ± SEM (n = 12 biologically independent samples examined over three independent experiments). Half-maximal inhibitory concentration (IC50) was calculated using a non-linear regression in GraphPad Prism. An unpaired two-sided t test was used to assess the differences of mean IC-50 (log-transformed values). Protein expression was quantified in ImageJ for all blots. SOTRA sotrastaurin, Ctrl DMSO-treated cells. Source data are provided as Source Data file.

