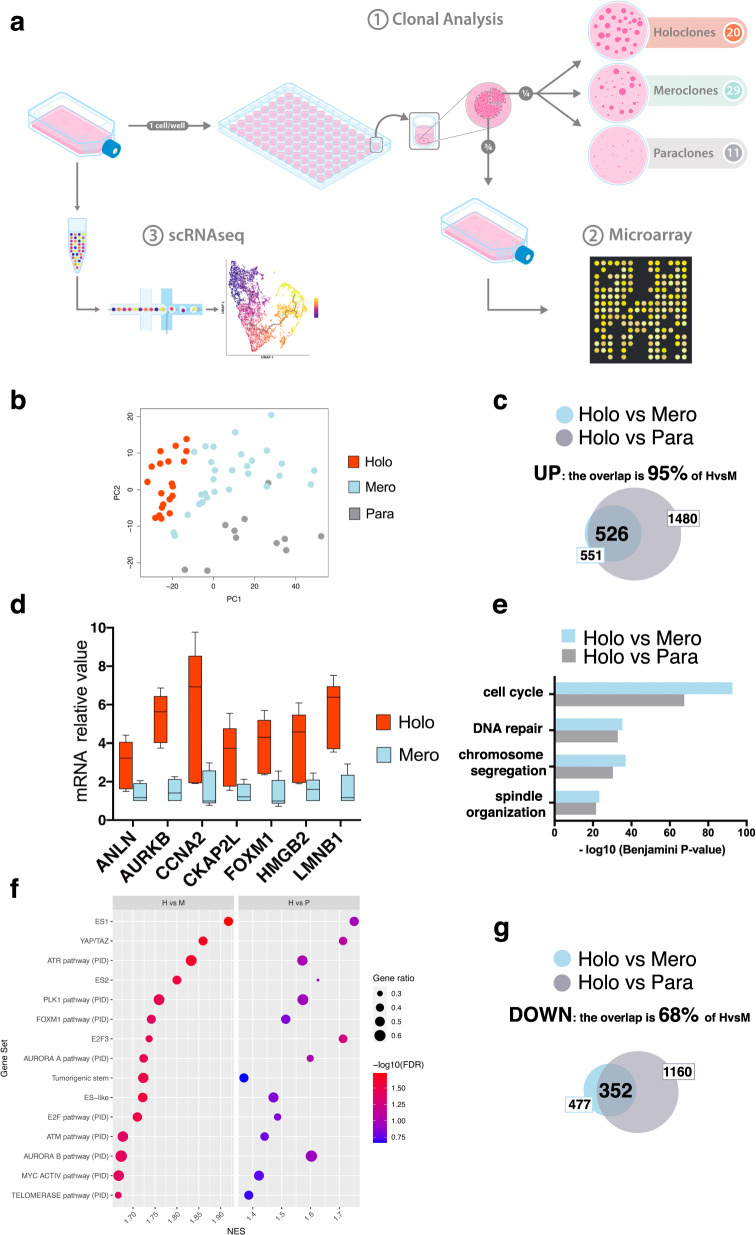
Fig. 1. Gene expression profile of human epidermal clonal types.
a From left to right: sub-confluent cultures were trypsinized, serially diluted, and inoculated (1 cell per well) onto 96-multiwell plates containing irradiated 3T3-J2 cells. After 7 days of cultivation, single clones were identified under an inverted microscope, trypsinized, transferred to two plates, and cultivated. One plate (one-quarter of the clone) was fixed 12 days later and stained with rhodamine B for the classification of clonal type (1, clonal analysis), which was determined as described in “Methods”. The second plate (three-quarters of the clone) was used for microarray analysis (2). The same sub-confluent cultures were used for single-cell RNA sequencing using 10X Genomics platform (3, scRNA-seq). b Principal component analysis (PCA). Each dot represents a different clone (n = 60). Holoclones, meroclones, and paraclones are identified with red, light blue, and gray dots, respectively. c Venn diagram showing the overlap between the genes significantly upregulated (FDR ≤ 5% and fold change ≥ 1.5) in holoclones as compared to meroclones (blue circle) or paraclones (gray circle). d qRT-PCR quantification of the mRNA levels of some of the genes comprised in the holoclone signature (ANLN, AURKB, CCNA2, CKAP2L, FOXM1, HMGB2, and LMNB1) (n = 5 holoclones and 5 meroclones). Expression levels were normalized per GAPDH and are given relative to one meroclone (arbitrarily set to 1). Holoclones and meroclones are identified with red and light blue columns, respectively. Median and min to max values displayed. e Gene ontology (GO) analysis of the genes upregulated (see panel c) in holoclones as compared to meroclones (blue bars) and to paraclones (gray bars). P values are calculated with one-sided Fisher’s Exact test and corrected for multiple tests with the Benjamini–Hochberg method. Histograms represent –log10 of the Benjamini–Hochberg corrected p value. f Bubble plot showing results of gene set enrichment analysis (GSEA) on microarray data obtained from the 60 clones of panel b. The normalized enrichment score (NES) is indicated on the x-axis; the dot size indicates the fraction of genes contributing to the leading-edge subset within the gene set. Dots are color-coded based on the enrichment FDR. The top 15 significant terms upregulated in holoclones as compared to both meroclones and paraclones are shown. g Venn diagram showing the overlap between the genes significantly downregulated (FDR ≤ 5% and fold change ≤ −1.5) in holoclones as compared to meroclones (blue circle) or paraclones (gray circle).

