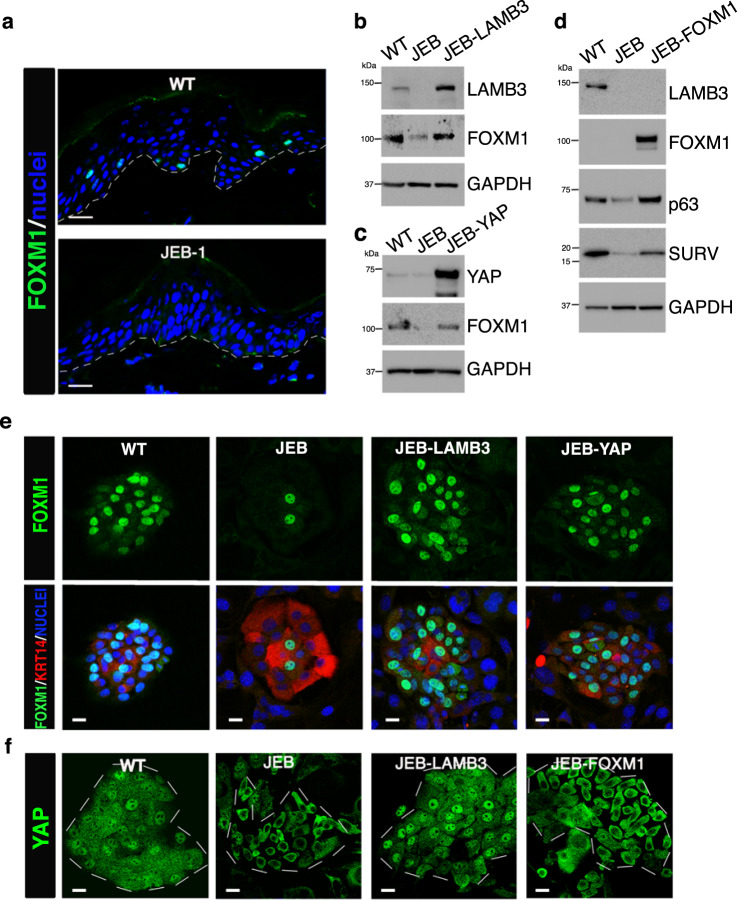
Fig. 6. FOXM1 sustains epidermal stem cells in JEB.
a Immunofluorescence analysis of FOXM1 expression in 7-μm-thick skin sections prepared from normal skin (WT) and LAMB3-deficient JEB patient (JEB-1). DAPI (blue) stains nuclei. Dotted line marks the epidermal–dermal junction. Scale bars, 20 μm. Representative image of what observed in skin biopsy derived from five independent healthy donors and five sections randomly taken from JEB-1 skin biopsy. b Western analysis of total cell extracts from normal keratinocytes (WT), JEB, LAMB3-transduced, JEB cultures immunostained with indicated antibodies (representative images of n = 6). c Western analysis of total cell extracts from normal keratinocytes (WT), JEB, YAP-transduced, JEB cultures immunostained with indicated antibodies (representative images of n = 3). d Western analysis of total cell extracts from normal keratinocytes (WT), JEB, FOXM1-transduced, JEB cultures immunostained with indicated antibodies. Endogenous FOXM1 is not visible in WT extract due to the presence of high levels of enforced FOXM1 in FOXM1-transduced cells (representative images of n = 4). e Representative images of FOXM1 localization (green) and Pan-Keratin (red) in JEB, LAMB3-, and YAP-transduced JEB. DAPI (blue) stains nuclei. Scale bar 20 μm (representative images of n = 3). f Representative images of YAP localization (green) in normal (WT), JEB, LAMB3-, and FOXM1-transduced JEB. Colonies are indicated with white dotted lines. Scale bar 20 μm (representative images of n = 4).

