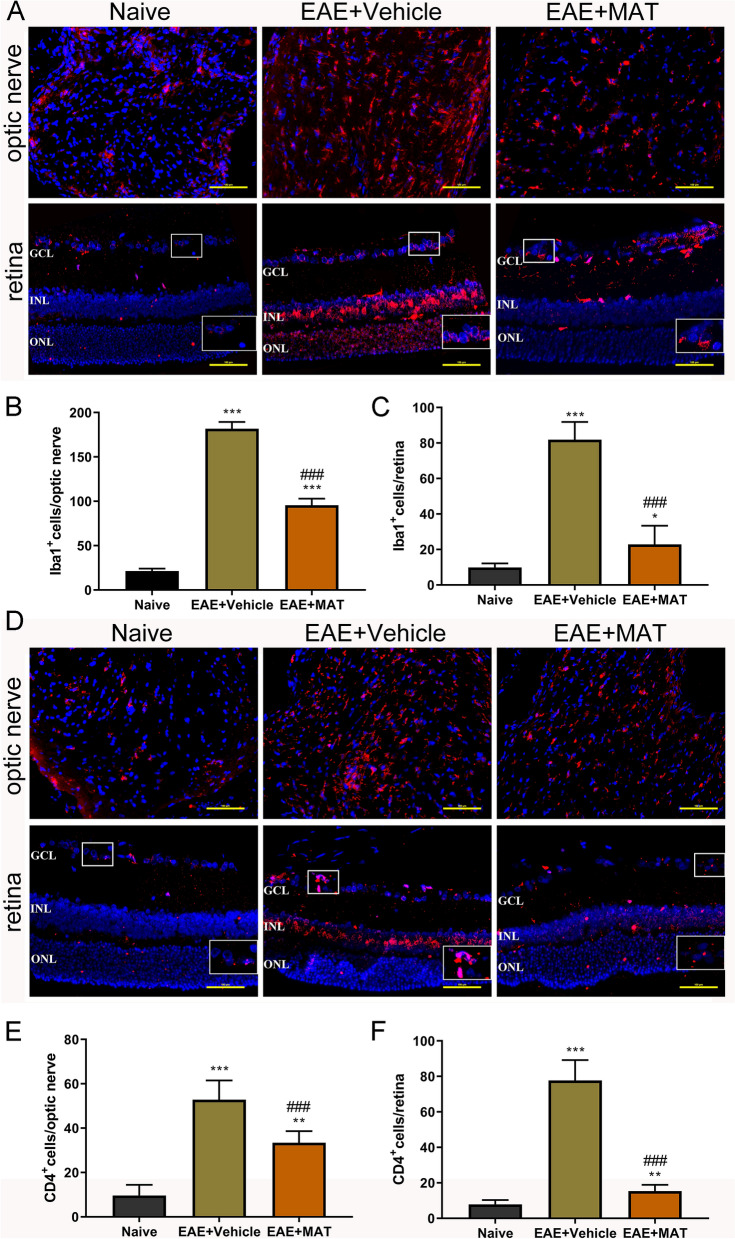
Figure 3.
MAT treatment reduced numbers of Iba1+ and CD4+ cells in the optic nerve and the retina. Both sides of optic nerves and the retina were harvested from rats described in Fig. 1 at day 18 p.i. Immunofluorescence staining for Iba1 (A, red) and CD4 (D, red) in optic nerve and the retina sections. Scale bars = 100 µm. (B) and (C) Quantitative analysis of the number of Iba1+ cells in the optic nerve and retina, and (E) and (F) quantitative analysis of the number of CD4+ cells in the optic nerve and retina. ONL, outer nuclear layer; INL: inner nuclear layer; GCL, ganglion cell layer. Data are expressed as mean ± SD (n = 20 optic nerves and the retinas from 10 rats per group). Multiple comparisons were performed using one-way ANOVA, followed by Student–Newman–Keuls test. *P < 0.05, **P < 0.01, ***P < 0.001, comparison with the naive group. ###P < 0.001, comparisons between vehicle- and MAT-treated groups.

