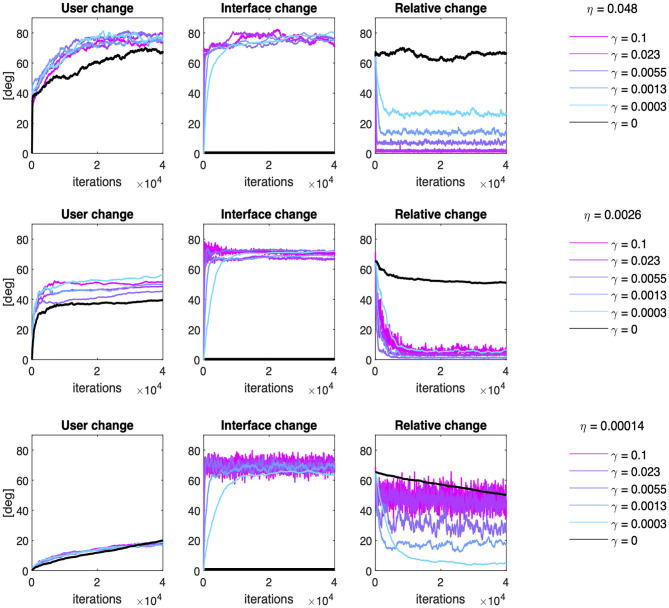
Figure 7.
Co-adaptation: examples of user and interface evolution though time. Effect of six different interface adaptation rates on the Subspace Angle of the simulated users relative to the initial condition (leftmost column), of the interface relative to the initial condition (middle columns) and the relative angle between the interface and the user at each training iteration (rightmost column). The effect of co-adaptation has been exemplified here for a slow-learning user (η = 0.00014, bottom row), a user with intermediate learning rate (η = 0.0026, middle row), and a fast-learning user (η = 0.048, top row).

