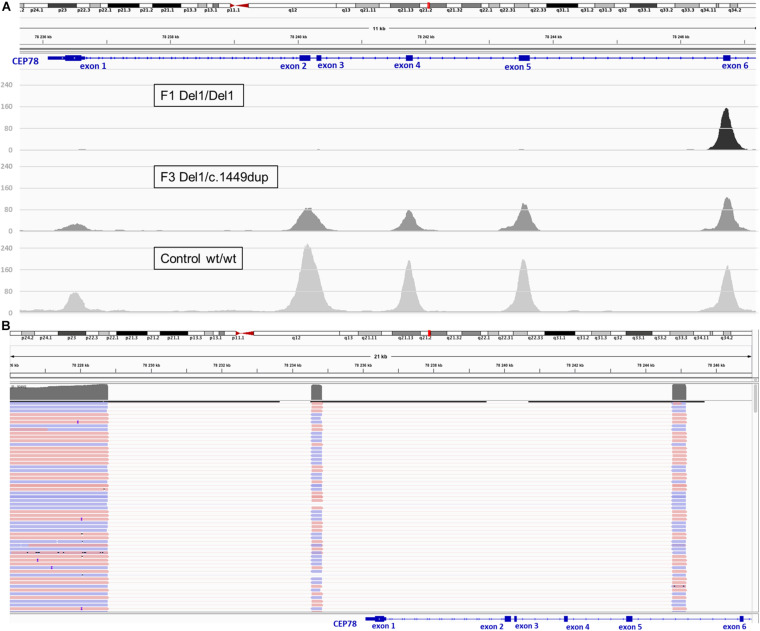
FIGURE 3.
Deletion coverage plots and IGV view of the complex SV detected via targeted LRS in F3, II:1. (A) ExomeDepth coverage plots for homozygous deletion (F1, II:1, top) and heterozygous deletion (F3, II:1, middle) compared to control (bottom). Coverage suggested for F3, II:1 the same deletion described for F1, II:1 but in heterozygous state. (B) Delineation of the SV via targeted LRS of the junction product obtained in F3, II:1 identified the same complex deletion–inversion–deletion found previously in F1, II:1.

