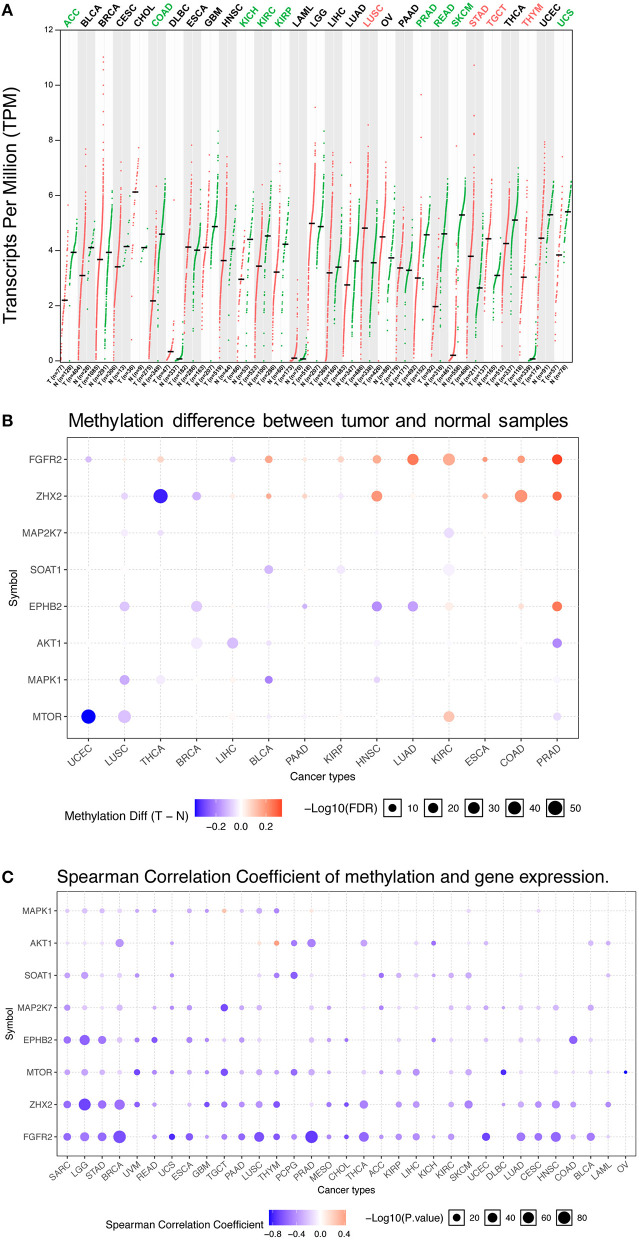
Figure 1.
FGFR2 mRNA expression and methylation in TCGA cancer tissues. (A) FGFR2 mRNA expression between tumors and the corresponding normal tissues across TCGA cancer types from GEPIA. (B) Bubble map of the differential methylation of FGFR2 and downstream genes between tumors and the corresponding normal tissues in 14 cancer types. Red dots indicate increased methylation in cancers, and blue dots indicate decreased methylation in cancers. (C) Bubble map showing the association between methylation and the expression of FGFR2 and downstream genes across different cancer types. Red dots represent the upregulated methylation level and expression level, and blue dots represent the upregulated methylation level and downregulated expression level. For the point in two bubble map: the size of the point represents statistical significance, where the larger the size, the greater the significance. The color depth of the point represents the difference, where the darker the color, the greater the difference. TPM, transcripts per million.

