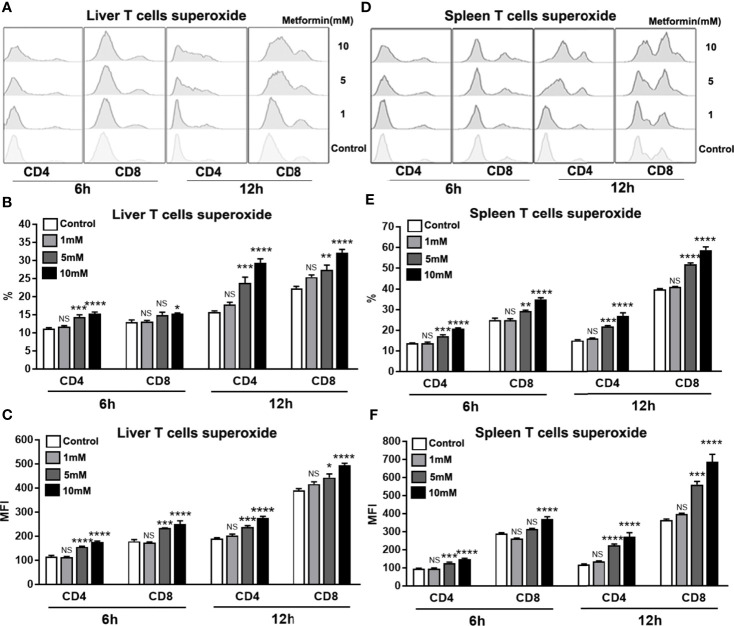
Figure 6.
Metformin promotes mitochondrial superoxide production in T cells. Mice were injected i.v. with 1.8 × 10⁹ pfu of AdLacZ and sacrificed at 7 dpi. Lymphocytes from liver and spleen were isolated and cultured with the indicated concentrations of metformin (0, 1, 5 and 10 mM) for 6 and 12 h. Cells were collected and stained with MitoSOX Red mitochondrial superoxide indicator. (A) Representative images of mitochondrial superoxide histogram in IHL. (B) Percentage of mitochondrial superoxide in IHL. (C) MFI of mitochondrial superoxide in IHL. (D) MFI of mitochondrial superoxide in IHL in splenic lymphocytes. (E) Percentage of mitochondrial superoxide in splenic lymphocytes. (F) MFI of mitochondrial superoxide in splenic lymphocytes. Data are representative of at least three independent experiments. Values are shown as mean ± SEM of n = 3-4 samples/group from single experiments representative of at least three experiments performed. One-way ANOVA with Tukey’s multiple comparisons test was used. Metformin treatment groups (1, 5 and 10 mM) were compared to the control group (0 mM). *p < 0.05; **p < 0.01; ***p < 0.001; ****p < 0.0001; ns, no significant difference.

