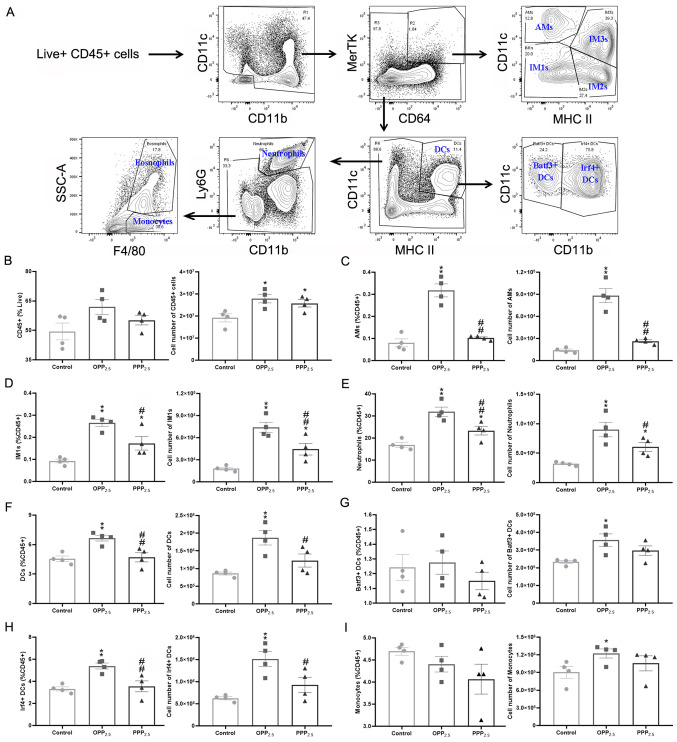
Figure 4.
Comparison of pulmonary immune cell numbers obtained by flow cytometry following exposure to OPP2.5 particles (80 µg), PPP2.5 particles (80 µg) or vehicle (50 µl sterile saline). (A) Fluorescence-activated cell sorting gating strategy used to identify pulmonary major immune cells. Live CD45+ cells were gated and myeloid cells were gated on CD11c vs. CD11b. Total myeloid cells were then plotted as MerTK vs. CD64 and the MerTK+ CD64+ macrophage gate was plotted as CD11c vs. MHC II to illustrate the AMs and IM1, IM2 and IM3. A macrophage-deficient gate was plotted with CD11c and MHC II to illustrate DCs, which were plotted as CD11c vs. CD11b to identify Batf3+ and Irf4+ DCs. A macrophage/DC-deficient gate was plotted as Ly6G vs. CD11b to identify neutrophils (CD11b+ Ly6G+) and a macrophage/DC/neutrophil-deficient gate was plotted as SSC vs. F4/80 to identify eosinophils and monocytes. (B) The proportion of CD45+ cells in living cells and the absolute number of CD45+ cells in each sample from treated and control groups. The proportion of (C) AMs, (D) IM1s, (E) neutrophils, (F) DCs, (G) Batf3+, (H) Irf4+ and (I) monocytes in CD45+ cells and their absolute number. The circles represent the corresponding data of each mouse in the control group, the squares represent the corresponding data of each mouse in the OPP2.5 group, and the triangles represent the corresponding data of each mouse in the PPP2.5 group. Data are presented as mean ± standard error of the mean (n=4/group). *P<0.05 and **P<0.01 vs. control. #P<0.05 and ##P<0.01 vs. OPP2.5 group. OPP2.5, original atmospheric particulate matter with a diameter ≤2.5 µm; PPP2.5, pure atmospheric particulate matter with a diameter ≤2.5 µm; CD, cluster of differentiation; MHC, major histocompatibility complex; AMs, alveolar macrophages; IM, interstitial macrophage; DC, dendritic cell; SSC, side scatter.

