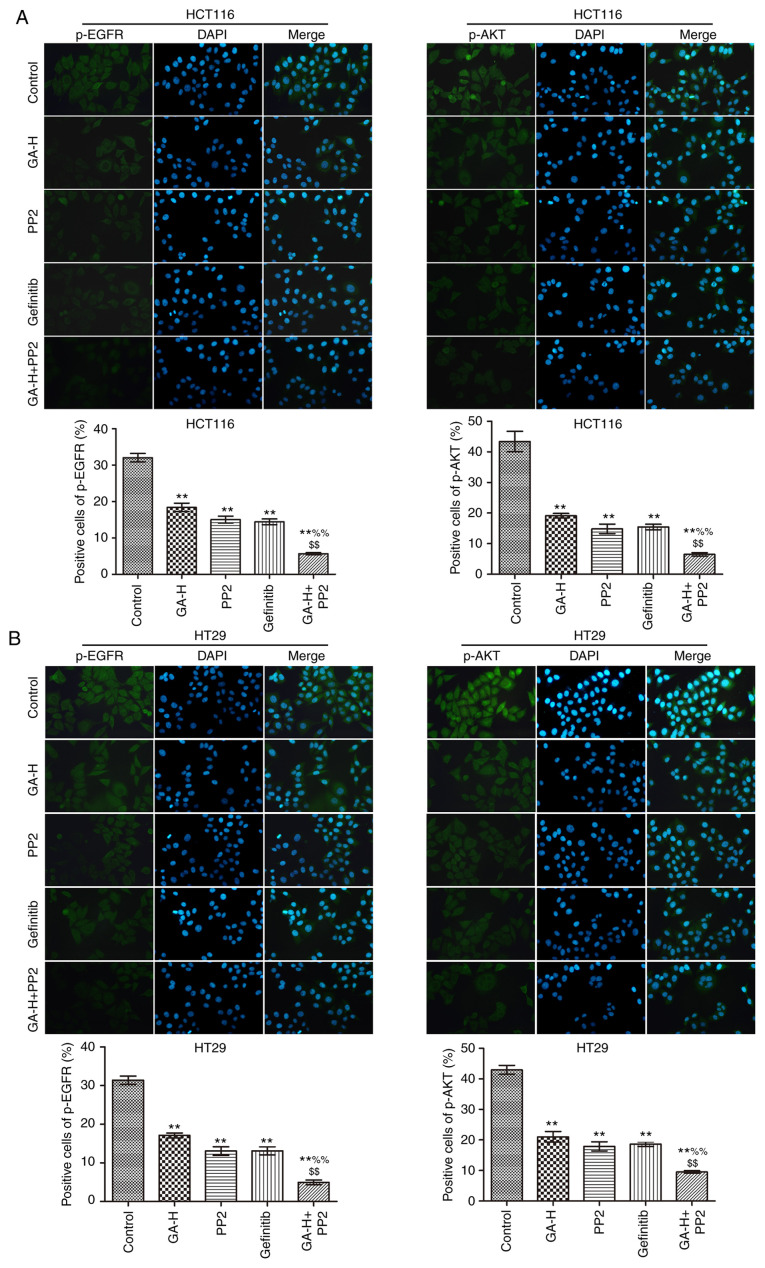
Figure 4.
Effects of GA on p-EGFR and p-AKT level. The effects of GA in (A) HCT116 and (B) HT29 colon cancer cells were analyzed by immunofluorescence. n=3. Magnification, x400. **P<0.01 vs. the control group; %%P<0.01 vs. the GA-H group; $$P<0.01 vs. the PP2 group. GA-H, gallic acid-high dose; p, phosphorylated.

