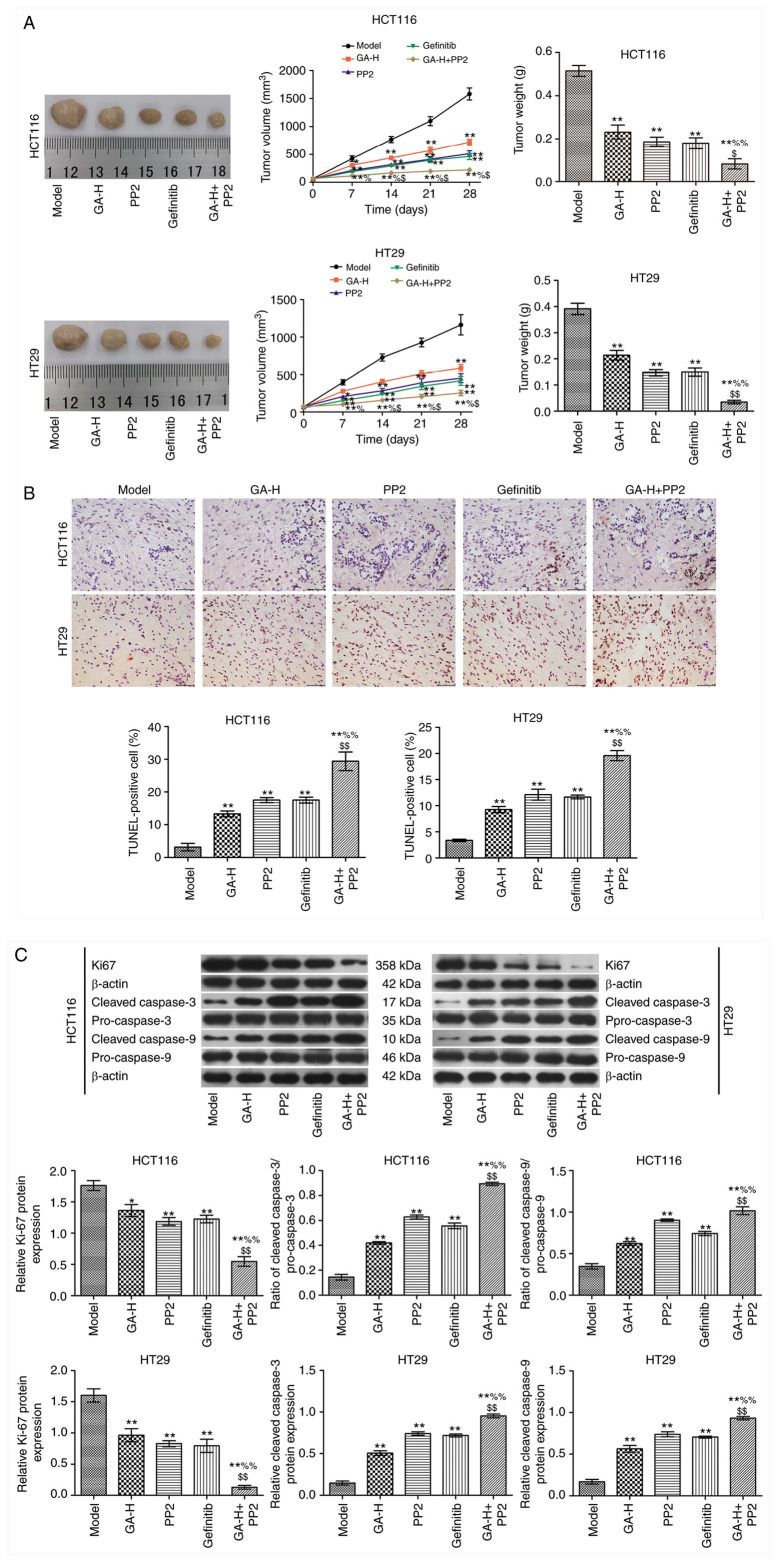
Figure 6.
GA decreases SRC and EGFR phosphorylation level to inhibit tumor growth. (A) Tumor images, volume and weight. (B) TUNEL staining (scale bar=50 µm). (C) Western blot analysis. n=6. *P<0.05 and **P<0.01 vs. the model group; %P<0.05 and %%P<0.01 vs. the GA-H group; $P<0.05 and $$P<0.01 vs. the PP2 group. GA-H, gallic acid-high dose.

