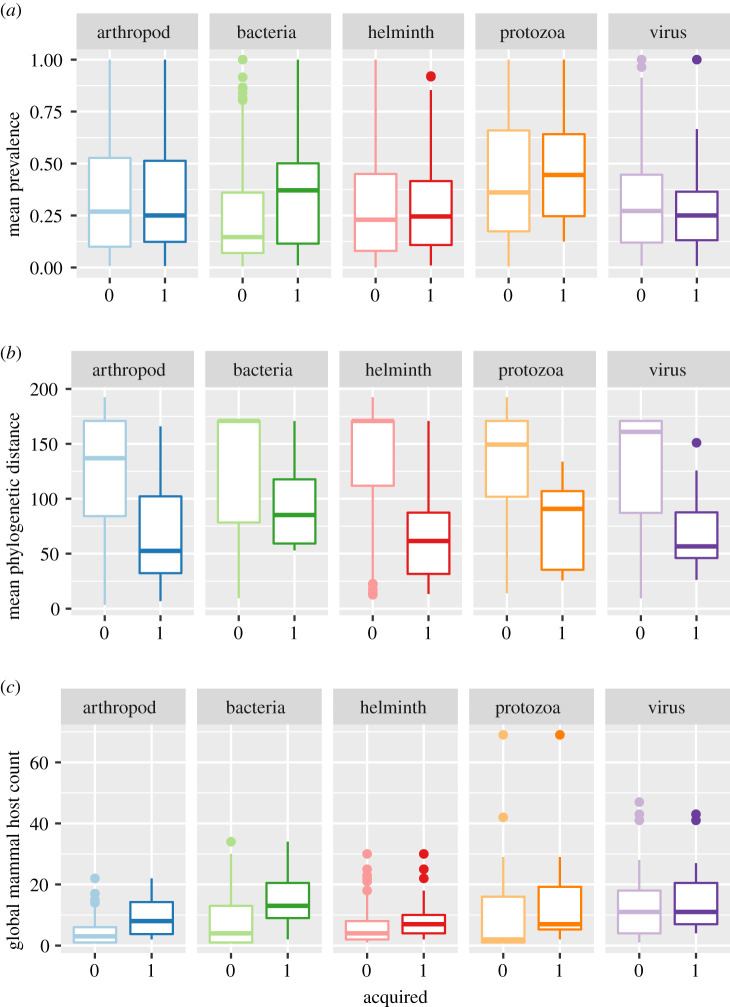
Figure 2.
Box plots of parasite acquisition (1 = acquired, 0 = not acquired) for the most influential predictors: (a) mean parasite prevalence, (b) mean phylogenetic distance and (c) global mammal host count. Data pooled across all 13 clusters. Centre lines of boxes correspond to the median value; lower and upper hinges represent first and third quartiles (25th and 75th percentiles), respectively. Whiskers extend to the minimum and maximum values no farther than 1.5 × IQR from the lower and upper hinges, respectively (IQR = interquartile range, the distance between hinges). Additional outlying points are plotted individually. (Online version in colour.)

