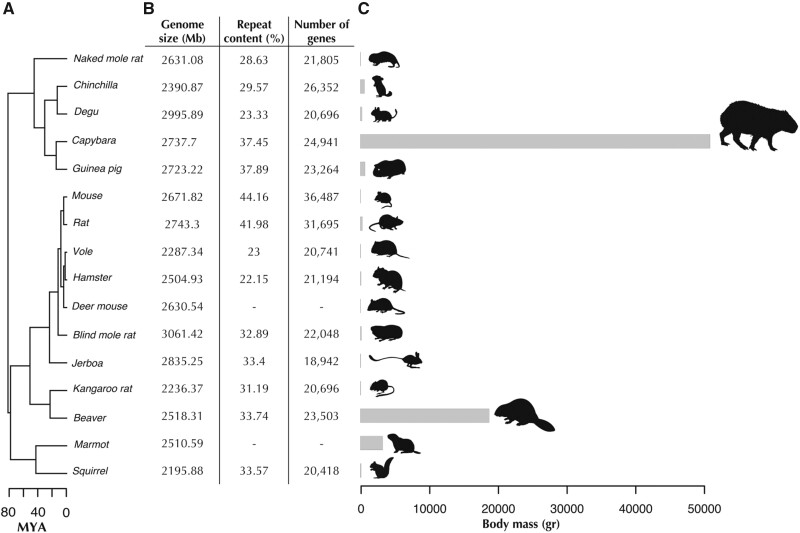
Fig. 1.
Divergence times, genome assembly statistics and body mass of representative rodents used for comparative genomics analyses. (A) Divergence times of rodent species using the topology obtained from the phylogenomic analysis (see Materials and Methods). Ma, million years ago. (B) Basic genome assembly statistics of rodent species included in comparative analyses. Repeat content and gene content were unavailable for deer mouse and marmot. (C) Body mass ranges from 20.5 g for the mouse to 55,000 g in the capybara, the largest living rodent.

