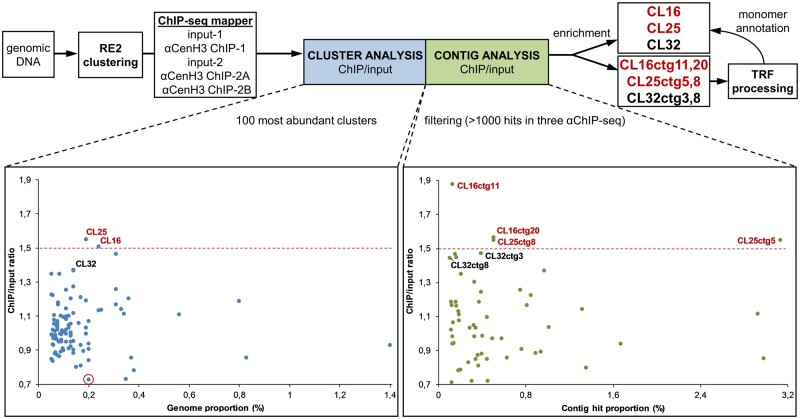
Fig. 5.
Identification of αCenH3 ChIP-enriched sequences. Strategies for identifying the most abundant repeat clusters and contigs associated with αCenH3 chromatin in Meloidogyne incognita (on the top). Relative enrichments of repeat DNA families in the ChIP-seq data are presented for clusters (left graph) and contigs (right graph) analysis. Clusters/contigs are represented by dots. The y axis is the ratio of the ChIP-seq reads to input-seq reads, representing the enrichment of each corresponding cluster/contig from the ChIP-seq data. The x axis is the genome proportion for each cluster (left graph) or hit proportion for each contig (right graph). A cluster rounded in red was used as a negative control in the IF-FISH experiment. Data with ChIP enrichment analyses of clusters and contigs with SDs are presented in supplementary table 6, Supplementary Material online.

