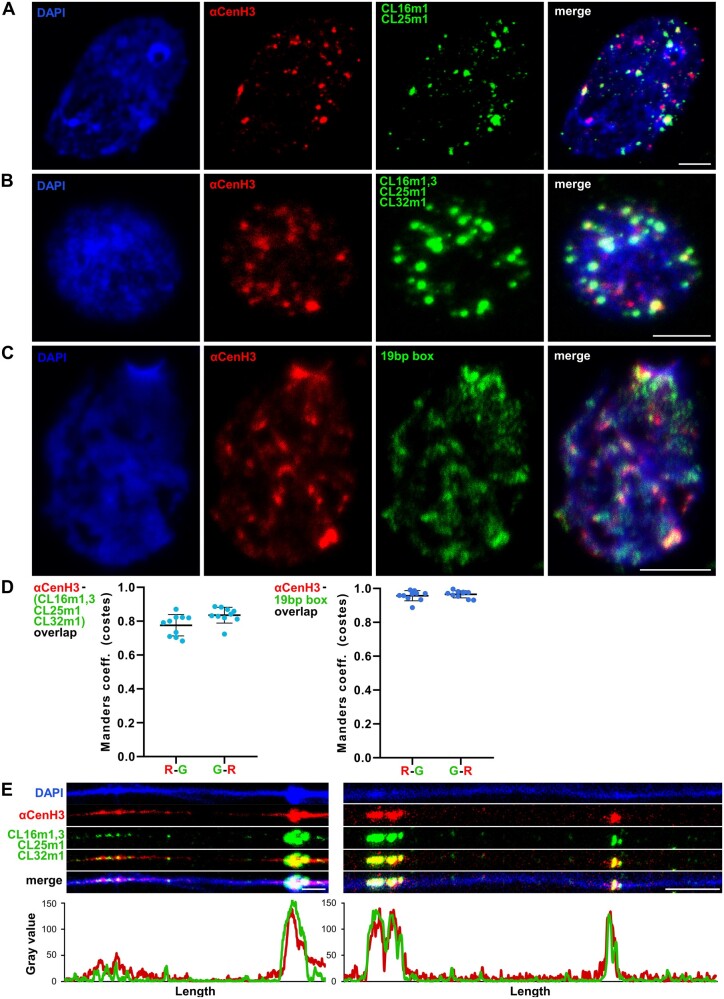
Fig. 7.
Simultaneous detection of αCenH3 centromere and αCenH3-associated DNA in Meloidogyne incognita. Slides were prepared from isolated reproductive tissue of females (ovaries and uterus). (A) Combined immunofluorescence with anti-αCenH3 raised in rabbit 2 (red) and FISH with CL16m1i and CL25m1i αCenH3-associated monomers as probes (green). (B) IF-FISH with anti-αCenH3 (red) and mixed probe for αCenH3-associated monomers, CL16m1i, CL16m3i, CL25m1i, and CL32m1i (green). The overlapped IF-FISH signals are yellow. (C) IF-PRINS with anti-αCenH3 raised in rabbit 2 (red) and centromeric 19-bp box sequence (green). (D) Quantification of signal colocalization for ten representative images with calculated Manders coefficients (costes thresholding) seen as high overlapping ratios for both channel pairs (R-G represents overlapping ratio of red vs. green signals; G-R is overlapping ratio of green vs. red signals); αCenH3 with αCenH3-associated monomers, CL16m1i, CL16m3i, CL25m1i, and CL32m1i (left panel) and αCenH3 with 19-bp box regions (right panel). Data are presented as mean ± SD (source data are listed in supplementary table 7, Supplementary Material online). (E) Dual-color fiber-IF/FISH using anti-αCenH3 (red) and αCenH3-associated monomers CL16m1i, CL16m3i, CL25m1i, and CL32m1i (green) as probes. The plots below the images represent intensities of the IF (red) and FISH (green) signals. DNA was counterstained with DAPI (blue). Images were acquired with confocal microscopy and shown as z-stack projection. Scale bar = 5 µm.

