Fig. 1.
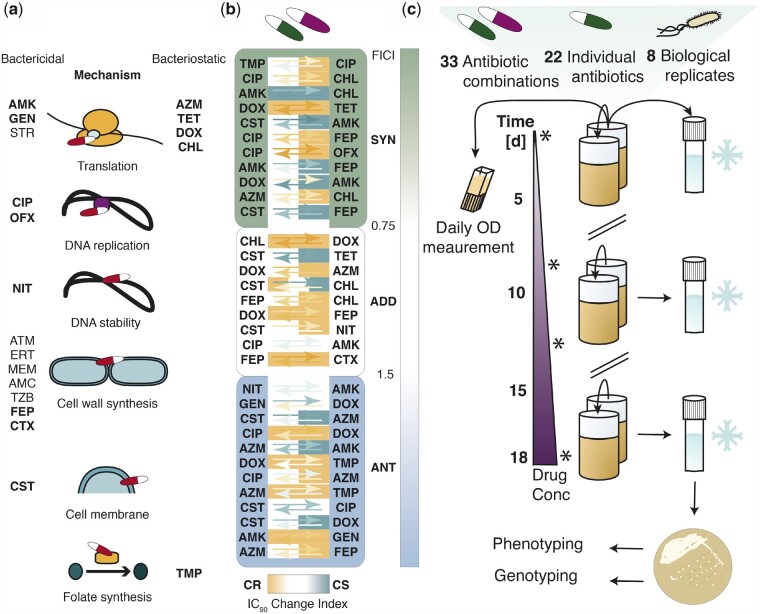
Drug properties and experimental setup. a Characteristics of the drugs chosen for adaptive laboratory evolution. The antibiotics were either bactericidal or bacteriostatic and covered multiple drug classes and six different processes in the cell. Drugs chosen for the evolution in drug pairs are depicted in bold. B The drug pairs, shown in ascending order of the fractional inhibitory concentration index (FICI), exhibit various phenotypic interactions: synergy (SYN, FICI < 0.75, green), additivity (ADD, FICI = 0.75-1.5, white) and antagonism (ANT, FICI > 1.5, blue); collateral resistance (CR, orange), a neutral collateral response (N, white) and collateral sensitivity (CS, turquoise). The arrows show the fold increase (orange, CR > 2 ∗ median ancestral wild type (WT) IC90) or decrease (turquoise, CS < 0.5 ∗ median WT IC90) in resistance compared to the WT. The direction of the arrows indicates the direction of the collateral drug response: e.g. lineages evolved to Trimethoprim display mild collateral resistance to Ciprofloxacin, while lineages evolved to Ciprofloxacin show mild collateral sensitivity to Trimethoprim. The space around the arrows is colored based on the classification of the drug pairs as CR, CS or neutral according to the collateral IC90 change index of each isolated biological replicate. Definitions of antibiotic abbreviations can be found in Table S2. Definitions of the different categories (SYN, ADD, ANT, CS, CR) as well as definitions of the FICI, IC90 and collateral IC90 change index can be found in materials and methods. The figure lists 32 antibiotic pairs due to the exclusion of the replicate lineages evolved to Sulfamethoxazole-Trimethoprim, as Sulfamethoxazole appeared unstable upon freezing, resulting in unreliable resistance determination. c Adaptive laboratory evolution of antibiotic resistance. Genetically barcoded E. coli lineages were evolved in eight biological replicate lineages with 22 different antibiotics and 33 different antibiotic combinations. The replicate lineages were grown in 96-deep-well-plates in 1 ml of LB containing antibiotic. Every 22 h, the cells were transferred to a new plate in a 20-fold dilution. In addition, the optical density was measured immediately before each transfer, and an aliquot of the population was saved as a glycerol stock. The evolution of resistance in each replicate lineage was monitored by measuring the IC90 at day 0, 8, 13 and 18, as indicated with stars. The evolution was started at subinhibitory drug concentrations (25 % of the WT IC90), and the WT IC90 was reached on the 7th day of the experiment. The evolution experiment ended after 18 days, when the WT IC90 was exceeded by more than 10-fold. Isolated colonies were obtained from frozen endpoints and subsequently used for whole-genome sequencing and susceptibility testing to multiple antibiotics.

