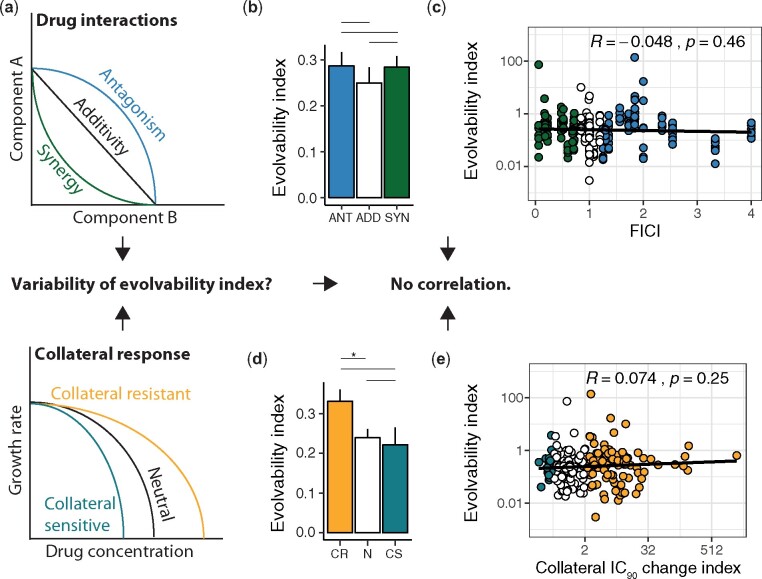
Fig. 3.
Phenotypic features of drug combinations are weak predictors of the evolvability. ANT = antagonistic drug pairs; ADD = additive drug pairs; SYN = synergistic drug pairs. CR = collateral resistance; N = neutral; CS = collateral sensitivity. a Schematic overview of the different types of drug interaction and collateral drug responses. It has been hypnotized previously that they might impact the evolvability of drug combinations. b The median evolvability indices (±MAD) for drug pairs grouped by the FICI (Mann-Whitney U-test, median(ANT) = 0.29, n(ANT) = 83, median(ADD) = 0.23, n(ADD) = 71, median(SYN) = 0.28, n(SYN) = 83, ANT-ADD: p = 0.3251, U = 3218.5, ANT- SYN: p = 0.8806, U = 3491.5, ADD-SYN: p = 0.3873, U = 3185.5, Bonferroni corrected, two-sided, confidence level = 0.95). c Scatterplot of the evolvability index versus FICI (Pearson correlation coefficient R = -0.048, p = 0.46). d Median evolvability indices (±MAD) for drug pairs grouped by the collateral IC90 change index (Mann-Whitney U- test, median(CR) = 0.36, n(CR) = 108, median(N) = 0.23, n(N) = 110, median(CS) = 0.22, n(CS) = 19, CR-N: p = 0.01654, U = 7056.5, CR-CS: p = 0.245, U = 1198.5, N-CS: p = 0.7397, U = 1095.5, Bonferroni corrected, two-sided, confidence level = 0.95). e Scatterplot of the evolvability index versus the collateral IC90 change index (Pearson correlation coefficient R = 0.074, p = 0.25).

