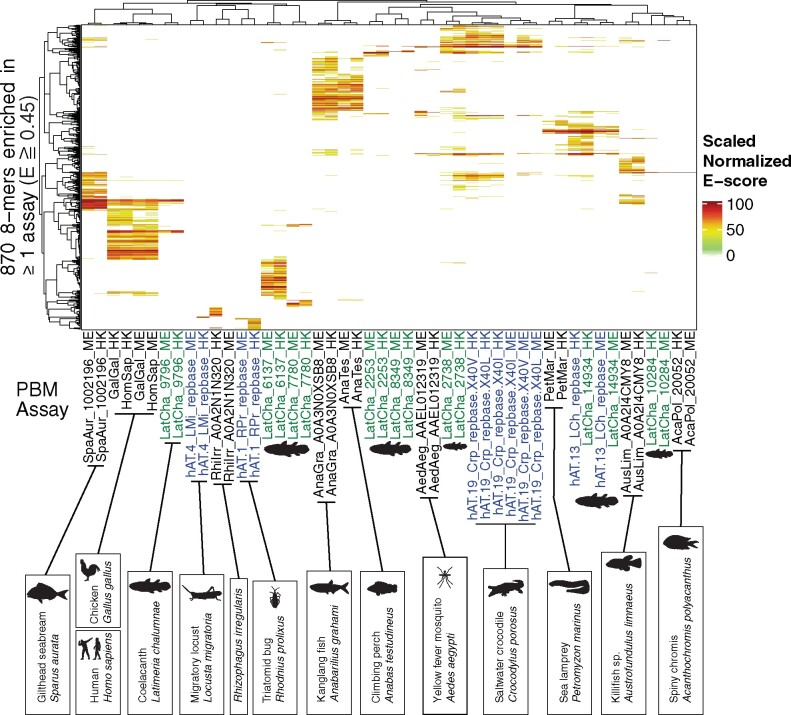
Fig. 1.
DNA 8-mer preferences of CGGBPs. Heatmap shows E-scores for 8-mers enriched (E ≧ 0.45) in at least one PBM assay. Cell values are scaled E-scores (, then normalized between 0 and 100) and are grouped by hierarchical agglomerative clustering with average linkage. Green labels represent coelacanth; blue labels represent hAT transposases. Dendrograms were produced through complete-linkage hierarchical clustering of Pearson distances. Silhouettes were obtained from PhyloPic, or created using Public Domain or Creative Commons images.

