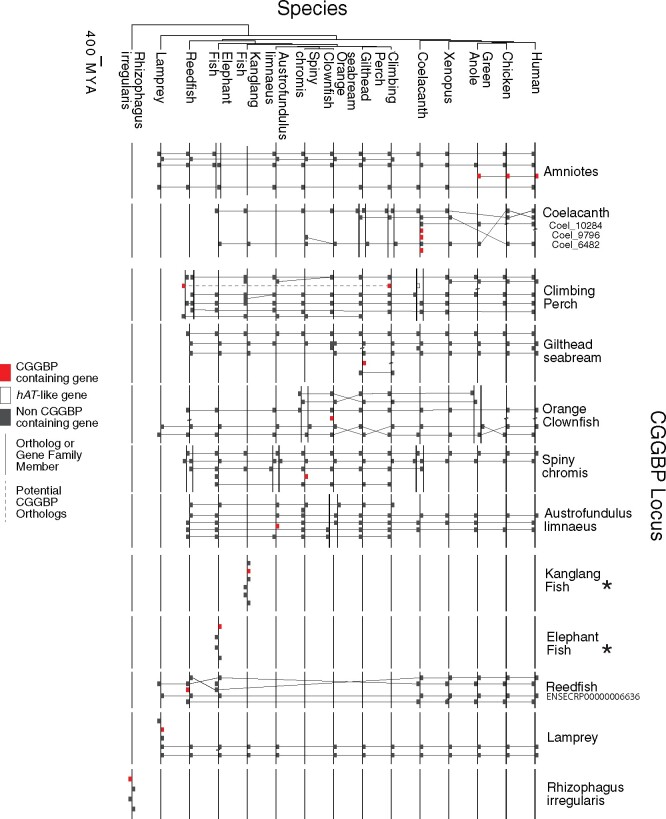
Fig. 3.
Synteny of CGGBP-containing loci. Orthologous loci are displayed as boxes along a bold line, and relationships between homologous genes indicated by thin connecting lines. All species with a sequence-specific CGGBP are included, as well as two fish with non-DBPs for comparison. Gene order was obtained from Ensembl or NCBI gene tracks. Nonhomologous intervening genes have been removed, with two diagonal lines indicating such gaps, and compared with orthologous loci in other species. For species with multiple paralogous CGGBPs, the name/accession of the visualized CGGBP is given. An asterisk is shown next to the name of species for which the CGGBP loci display no synteny, but which do contain conserved genes. Species tree from TimeTree (Kumar et al. 2017).

