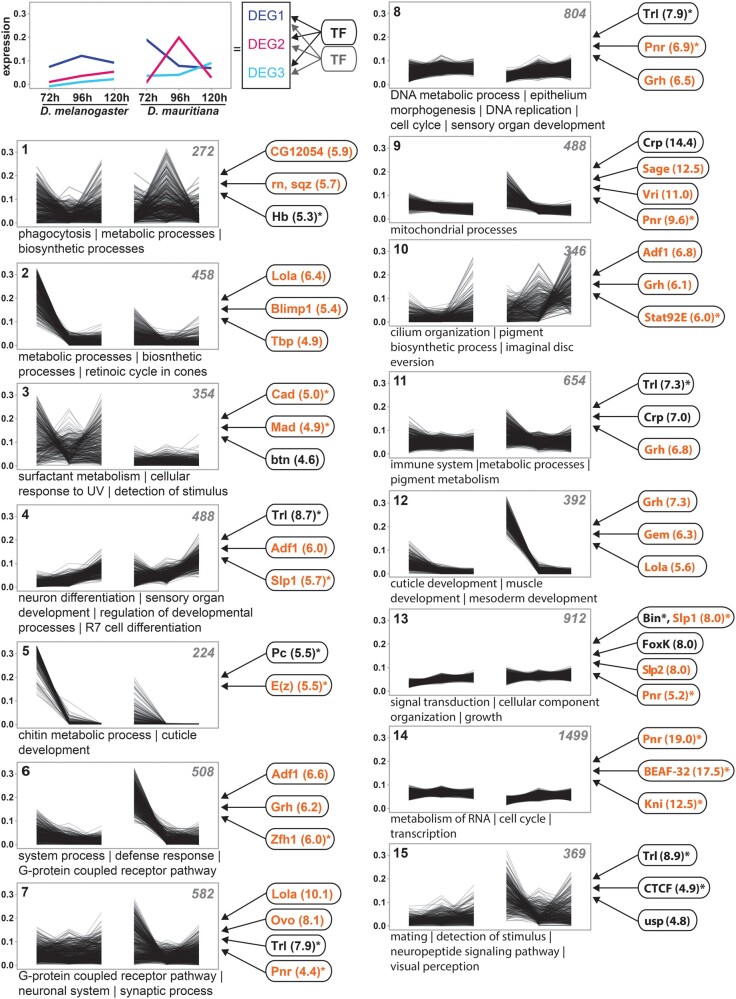
Fig. 2.
Extensive remodeling of the transcriptome underlying eye–antennal disc development. The scheme in the upper left corner illustrates the rational of the analysis. DEGs with similar expression profiles were clustered. Assuming that coexpressed genes are regulated by similar TFs, enriched TF-binding motifs were identified in accessible chromatin regions of genes within each cluster (see Materials and Methods for details). Cluster analysis of all differentially expressed genes between Drosophila melanogaster and D. mauritiana. The number of genes in each cluster is given in the upper right corner. Significantly enriched GO terms are provided for each cluster. TFs refer to potential upstream regulators and the respective NES values (nonredundant occurrence and excluding non-Drosophila motifs). Factors written in orange are significantly differentially expressed in at least one stage between the two species. Factors marked with an asterisk are among the top 10% of highly connected transcriptional regulators (i.e., hub genes). A complete list of enriched GO terms and potential upstream factors is available in supplementary table S2, Supplementary Material online.

