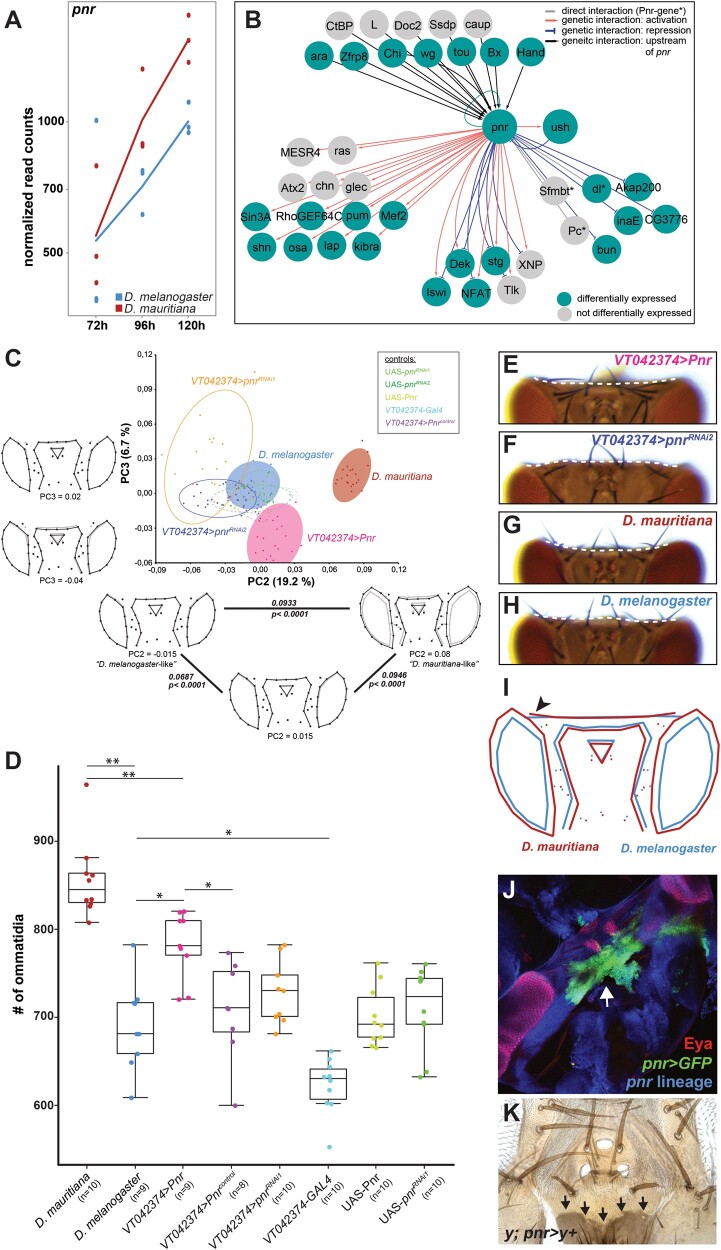
Fig. 3.
Pnr is a phenotypically relevant hub gene during eye–antennal disc development. (A) Expression dynamics of the pnr transcript at the three developmental stages in Drosophila melanogaster (blue) and D. mauritiana (red) based on rlog transformed read counts. (B) Network reconstruction of known interactions upstream and downstream of Pnr that overlaps with our Pnr target gene list. Fourteen of the 29 target genes are activated (red edges) and 8 genes are repressed (blue edges) by Pnr. Six target genes showed both types of interactions. Twenty-one of the 30 putative Pnr target genes (68%) were differentially expressed (green nodes). (C) Principal component analysis of dorsal head shapes. Shape outlines for principal component (PC) values are given along the PC2 and PC3 axes, respectively, as indicated below each outline. In the triangle along PC2, the Procrustes distance between each shown shape outline is provided, as well as the P value after permutation test with 1,000 cycles. Overexpression of pnr (VT042374 > Pnr) shifts the dorsal head shape toward a D. mauritiana head shape, whereas reduction of pnr expression (VT042374 > pnrRNAi1 and VT042374 > pnrRNAi2) resulted in an opposite shift. (D) Number of ommatidia counted in one compound eye per individual. The significance was calculated by ANOVA and each pairwise comparison was calculated using Tukey’s Honestly Significant Difference technique test; **≤0.01; *≤0.05. The color code in (C) and (D) is the same, and control flies were either the Gal4 driver line (VT042374-Gal4) or the UAS effector lines (UAS-Pnr, UAS-pnrRNAi1, UAS-pnrRNAi2) without crossing them. VT042374 > Pnrcontrol are CyO carrying offspring of the VT042374 > Pnr cross that do not contain the UAS-Pnr transgene and thus no overexpression. (E) Representative dorsal view of an adult head after overexpression of pnr and (F) after knockdown of pnr. See supplementary figure S9, Supplementary Material online, for quantification and controls for E and F. (G) Representative dorsal view of an adult head D. mauritiana. (H) Representative dorsal view of an adult head of D. melanogaster. The dotted lines in E–H mark the border of the occipital region. (I) Mean shapes of D. melanogaster (blue) and D. mauritiana (red) heads after Discriminant Function Analysis including seven additional landmarks in the occipital region. The black arrowhead marks the lateral bending of the occipital region in D. mauritiana (Procrustes distance: 0.094; P < 0.0001 based on permutation test with 1,000 runs; nD. mauritiana = 20; nD. melanogaster = 18). (J) pnr expression in developing pupal head structures. Cells marked with pnr > GFP accumulated in the future occipital region (green) behind the developing ocelli (red), and the head region where the two discs fuse (white arrow). (K) pnr lineage in adult dorsal heads shown by cells in which “yellow” expression is restored (black arrows).

