Fig. 4.
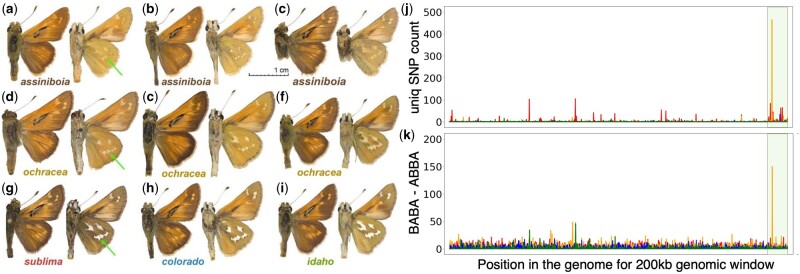
Similarity in wing pattern between Hesperia colorado ochracea and H. c. assiniboia likely caused by the introgression of a 200-kb Z-linked genomic region. Wing pattern variation in (a–c) assiniboia and (d–f) ochracea specimens; (g–i) typical specimens of other Hesperia populations in Colorado. Green arrows denote pale spots on the hindwing differing between populations. Voucher numbers for (a–i) are NVG-18027B08, NVG-18027B09, NVG-18027B10, NVG-15111B01, NVG-5533, NVG-16108A05, NVG-5532, NVG-16108C02, and NVG-16108B04, respectively; see supplementary table S1, Supplementary Material online, for additional data. (j) Number of unique SNPs in different populations in 200-kb windows throughout the genome. (k) Introgression from assiniboia to four Hesperia populations in Colorado identified using the ABBA-BABA test. The y axis shows the difference between the number of positions with the pattern ABBA and the number of positions with the pattern BABA in a 200-kb genomic window (negatives omitted). The x axis on both plots is the position of the window in the genome (concatenated scaffolds). Z chromosome scaffolds are placed last (highlighted pale olive). Counts are colored by taxon: sublima (red), colorado (blue), idaho (green), and ochracea (orange).

