Fig. 3.

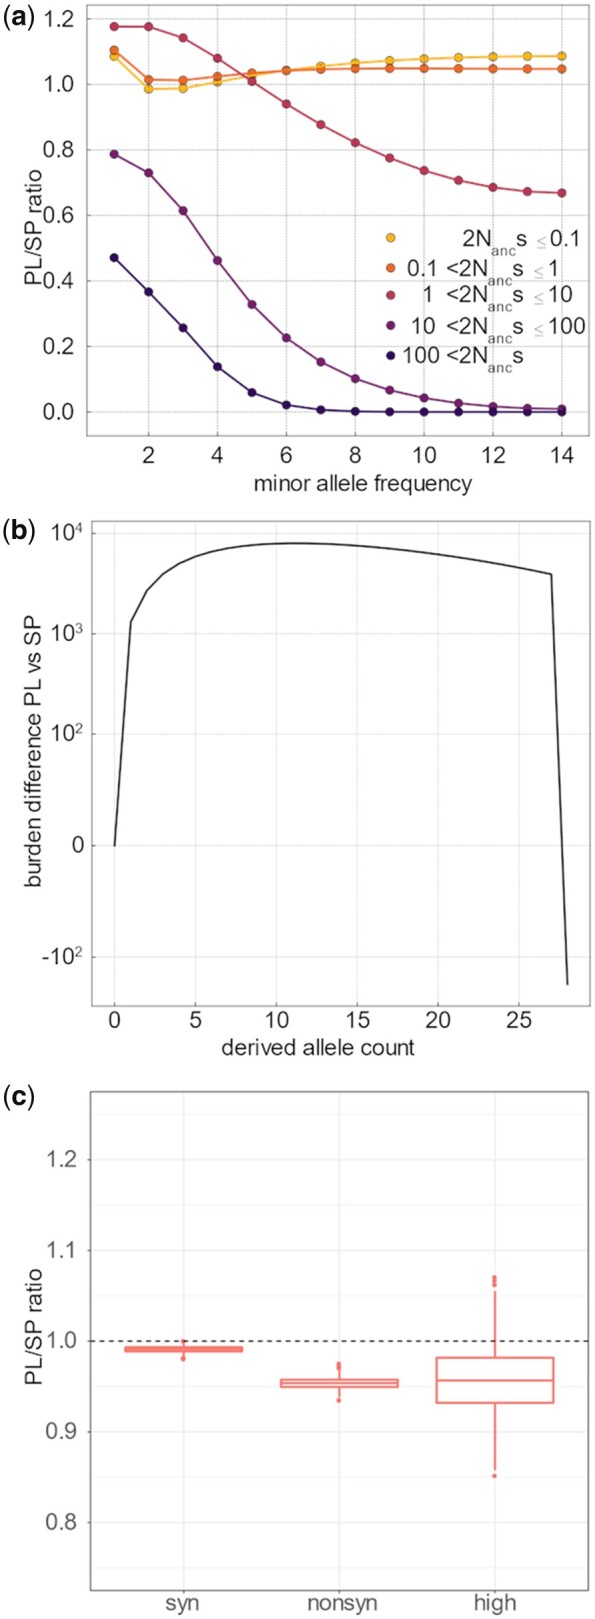
Comparative efficacy of selection and genomic burden in SP and PL. (a) Ratio of PL/SP of the proportion of variants for each s category and each allele frequency bin. Values below 1 indicate that mutations of a given size effect are less abundant in PL than in SP, within each frequency bin. This estimate is based on the joint estimate of the gamma distribution of the DFE using the Poisson optimization and the expected SFS in each category of s. As a proportion of the total number of variants at each count, PL has more slightly neutral and nearly neutral mutations (orange lines) at low frequency and considerably less strongly deleterious mutations (purple lines). (b) Difference in per-individual cumulative derived allele burden between PL and SP. The cumulative derived allele burden is based on the contribution of deleterious variants depending on their count in the population considering the point mass s estimate of deleterious mutations of −1.2, which was shown to fit the data well. Low-frequency mutations contribute more to the burden in PL—negative values indicate that an excess of up to 10,000 deleterious mutations with count 10 or less in the population accumulate in each individual in PL-, whereas fixed mutations (count 28 in the population) play an important role in SP. The net difference, given by the end of the line, is 185. (c) Comparison of genomic load in PL and SP, for synonymous, nonsynonymous, and high impact mutations. For each population, the genomic load was calculated as the mean number of nonsynonymous corrected by the total number of genotyped sites for each sampled individual. The ratio of mean per individual genomic load of PL versus SP is given. The distribution was established by bootstrap of the genome (see Materials and Methods).
