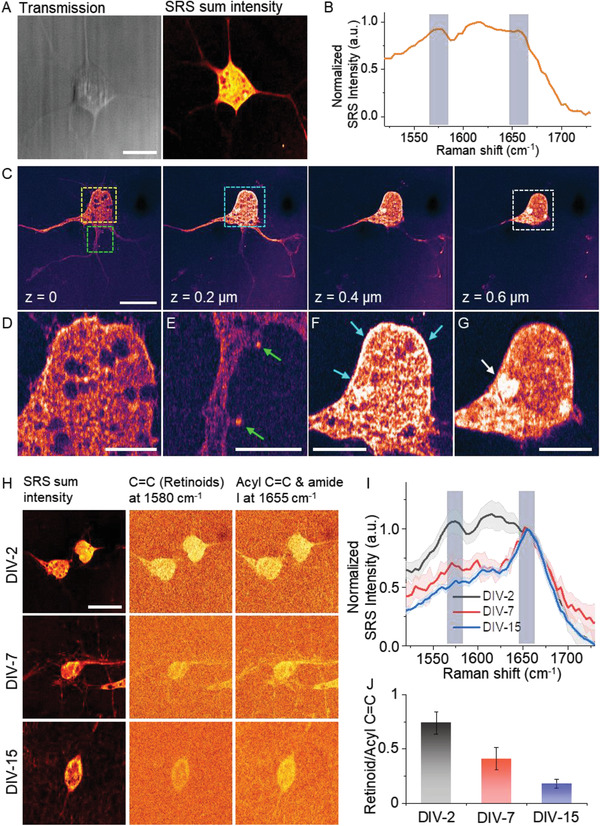
Figure 3.

VP‐SRS reveals heterogeneous distribution of retinoids in embryonic neurons at different stages. A) The transmission and SRS sum intensity images of a DIV‐2 embryonic neuron. B) SRS spectrum of neuron in (A). C) 3D SRS imaging of a DIV‐2 embryonic neuron at 1580 cm−1. D–G) Zoom‐in images of the area in yellow (D), green (E), blue (F), and white squares (g), marked in (C). H) SRS sum intensity images (left), SRS image of retinoid C=C bond at 1580 cm−1 (middle), and SRS image of the mixture of acyl C=C bond and amide I band at 1655 cm−1 (right), of the DIV‐2 (upper), DIV‐7 (middle), and DIV‐15 (lower) embryonic neurons. I) SRS spectrum of the DIV‐2, DIV‐7, and DIV‐15 embryonic neurons normalized at 1655 cm−1. J) Ratio of TA‐subtracted retinoid signal at 1580 cm−1 with to mixed signal from acyl C=C and amide I at 1655 cm−1 of the DIV‐2, DIV‐7, and DIV‐15 embryonic neurons. Scale bar: (A,C,H) 10 µm, (D–G) 2.5 µm.
