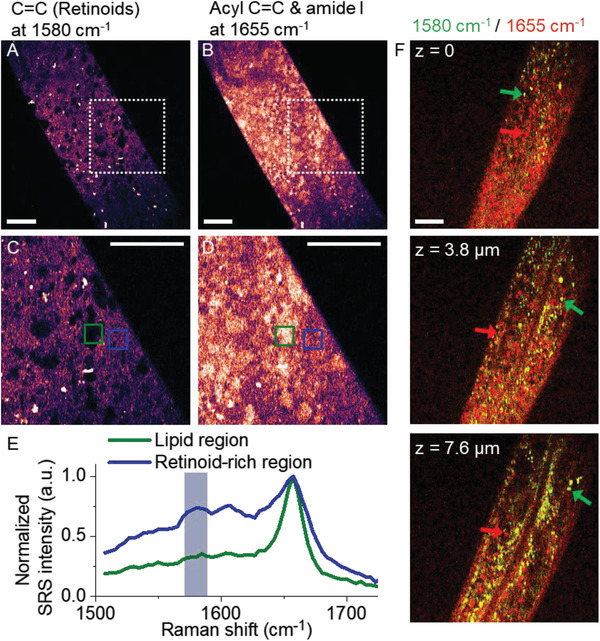
Figure 6.

VP‐SRS reveals heterogeneous distribution of retinoids in C. elegans. A,B) VP‐SRS images of a living C. elegan (A) at 1580 cm−1 corresponding to C=C bond of retinoid, and (B) at 1655 cm−1 corresponding to a mixture of acyl C=C bond and amide I band. C,D) Zoom‐in VP‐SRS images (C) at 1580 cm−1, and (D) at 1655 cm−1 of the white dashed square in (A), and (B), respectively. E) SRS spectra of the retinoid‐rich region indicated by the blue square, and LD‐like region from green square in (C), and (D), respectively. The spectra are normalized at 1655 cm−1. F) Two‐color, 3D SRS imaging of a C. elegan for z‐axis position at 0 (upper), at 3.8 µm (middle), and at 7.6 µm (lower). SRS imaging at 1580 and 1655 cm−1 is labeled as green and red, respectively. Scale bar: 10 µm.
