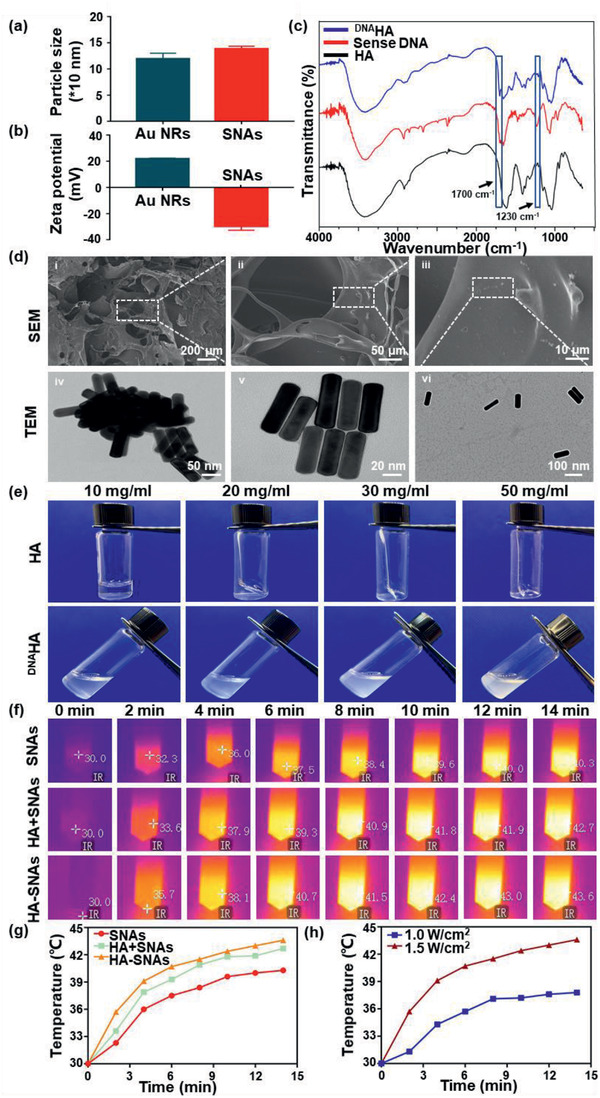
Figure 1.

Characterization of the HA‐SNAs system. a) Size and b) zeta(ζ)‐potential changes of the nanosystem during the preparation. c) FTIR spectra of the HA, sense DNA, and DNAHA. d) SEM images of HA‐SNAs at different magnification and the TEM images of (d(iv)) Au NPs, d(v)) SNAs, and d(vi)) HA‐SNAs. f) Photothermal images of SNAs, HA+SNAs, HA‐SNAs irradiated at 808 nm (1.5 W cm−2) for 14 min, respectively. g) Temperature profiles of SNAs, HA+SNAs, HA‐SNAs irradiated at 808 nm (1.5 W cm−2) for 14 min, respectively. h) Temperature profiles of HA‐SNAs irradiated at 808 nm for 14 min with power densities of 1.0 and 1.5 W cm−2, respectively.
