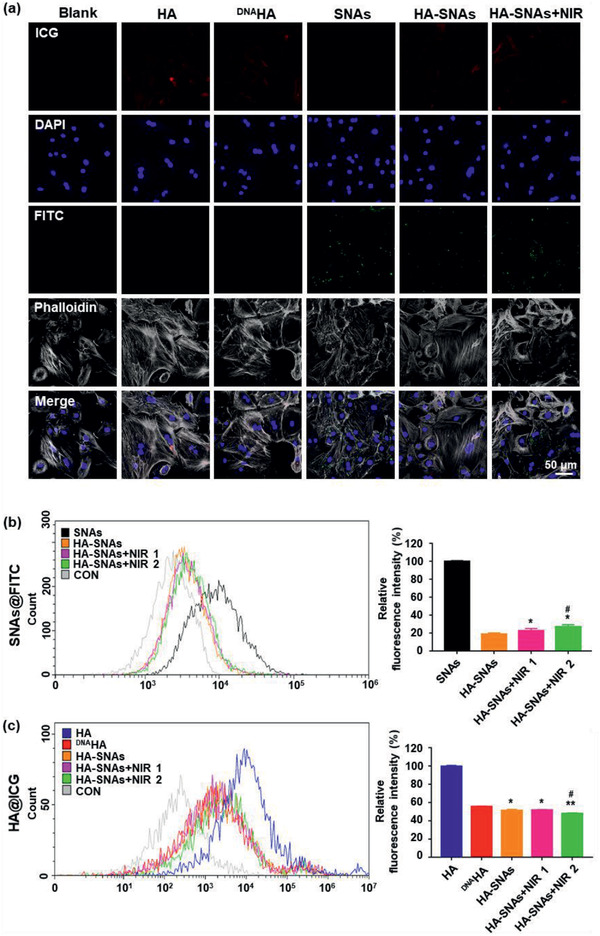
Figure 3.

Cellular uptake. a) Representative photomicrographs of chondrocytes acquired using CLSM treated with HA, DNAHA, SNAs, HA‐SNAs, HA‐SNAs+NIR for 12 h. Red: ICG labeling HA; Green: FITC labeling SNAs; blue: DAPI labeling cell nuclei; gray: Phalloidin labeling cell actin. b) Flow cytometry analysis of cellular uptake after incubating SNAs, HA‐SNAs, HA‐SNAs+NIR for 12 h with chondrocytes where SNAs are labeled with FITC with the corresponding cellular uptake quantification. n = 3; *p < 0.05, **p < 0.01, compared with HA‐SNAs; # p < 0.05, compared with HA‐SNAs+NIR 1. c) Flow cytometry analysis of cellular uptake after incubating HA, DNAHA, HA‐SNAs, HA‐SNAs+NIR with chondrocytes where HA are labeled with ICG. Correspondingly, the cellular uptake is quantified. n = 3; *p < 0.05, **p < 0.01, compared with DNAHA; # p < 0.05, compared with HA‐SNAs. The power density of NIR light is 1 W cm−2.
