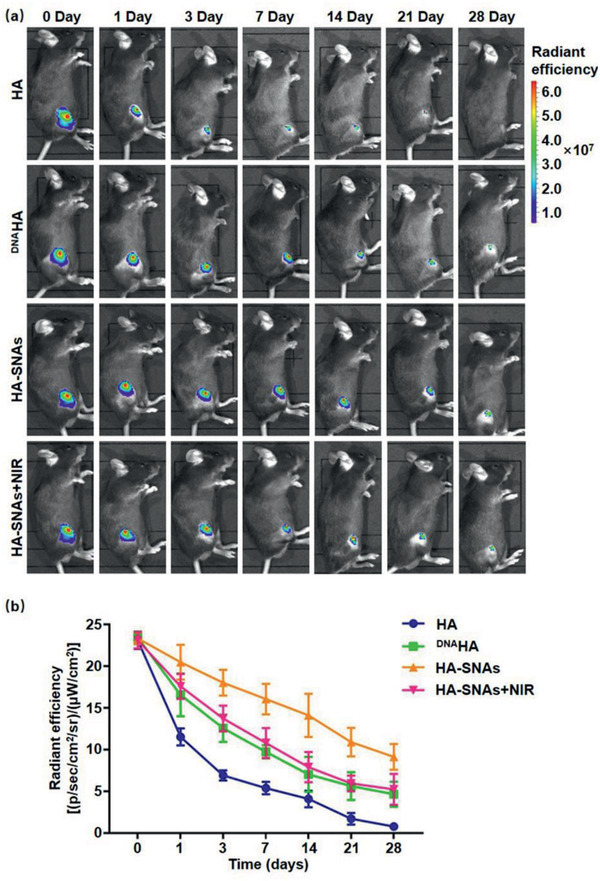
Figure 4.

Joint residence of the injected nanosystem. (–a) Representative IVIS images of mice knee joints over 28 days after injection of fluorescent HA, DNAHA, HA‐SNAs and HA‐SNAs+NIR. Fluorescence scale: max = 7.0 × 10⁷, min = 1.0 × 10⁷. b) Time course of fluorescent radiant efficiency within joints corresponding to a). n = 3. Half‐lives are statistically different for each dataset (p < 0.05).
