Figure 7.

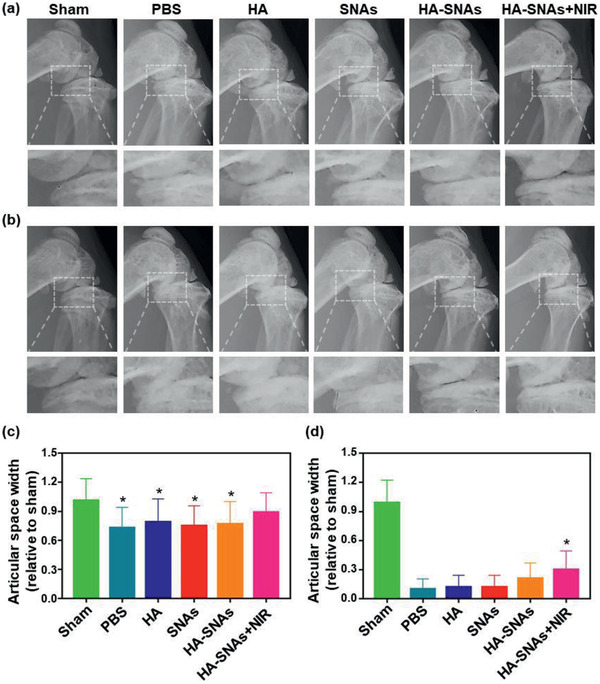
X‐ray radiography. Representative X‐ray radiographs of the mice knee joints showing the treatment of DMM‐induced OA after the intra‐articular injection of PBS, HA, SNAs, HA‐SNAs, HA‐SNAs+NIR at a) 4 weeks and at b) 12 weeks after surgery. The relative articular space width between the medial compartments of mouse knee joints at c) 4 weeks and at d) 12 weeks after surgery. n = 5, *p < 0.05, compared with the PBS group.
