
Figure 8.
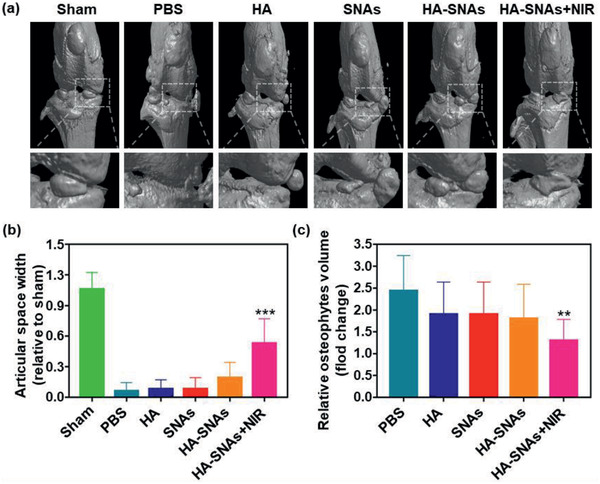
Micro‐CT arthrography. a) Representative micro‐CT scanning and reconstruction of mouse knee joints showing the treatment of DMM‐induced OA after the intra‐articular injection of PBS, HA, SNAs, HA‐SNAs, HA‐SNAs+NIR at 12 weeks after surgery. b) The relative articular space width between the medial compartments of mice knee joints at 12 weeks after surgery. c) The relative osteophytes volume of the experimental groups. n = 5, **p < 0.01, ***p < 0.001, compared with the PBS group.