
Figure 1.
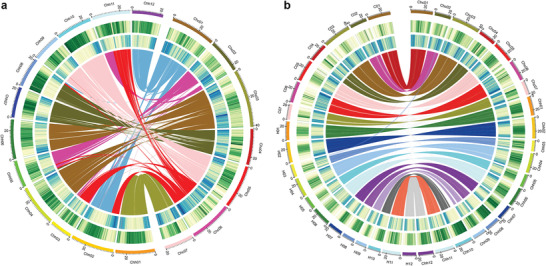
Characterization of the C. ×hytivus genome and chromosomes. a) Circos diagram showing relationships of Chc and Chh subgenome chromosomal pseudomolecules. The scale for the chromosomes (outer bars) is megabase; colors represent the density of transposon elements (blue) and genes (green). Homeologous blocks of ≥30 gene pairs between Chc01–Chc07 and Chh01–Chh12 are connected with lines. b) Syntenic comparisons between C. ×hytivus subgenomes and diploid HH and CC genomes. The outer three circles are chromosomes, density of genes, and density of transposon elements, respectively. Colored lines connect blocks with ≥30 orthologous gene pairs between the Chc and Chh subgenomes and CC and HH genomes, respectively, based on BLASP.