Figure 2.

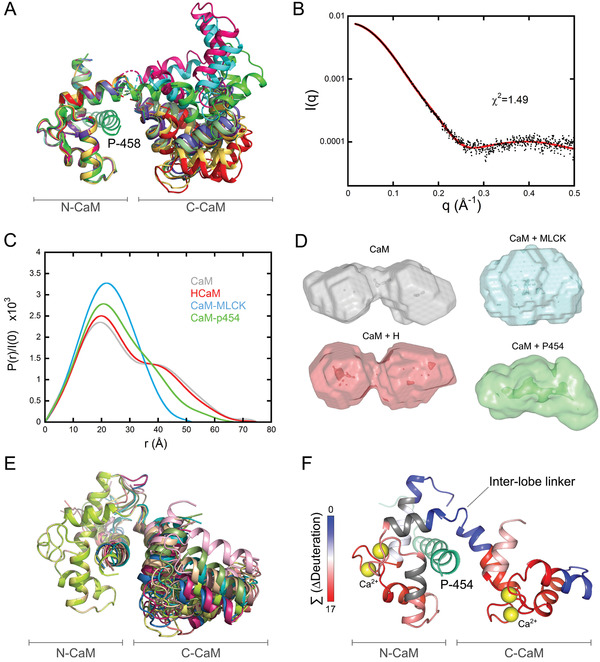
Structure and dynamics of the P454:CaM complex. A) The twelve P458:CaM crystal structures (PDB 6YNS) are displayed after superimposition of Cαs over the range 10 to 70 included, corresponding to the N‐ter lobe of calmodulin. The crystal structure 1CLL[ 92 ] of the extended conformation of CaM is shown in light green. B) Experimental SAXS curve of the P454:CaM complex (black dots) superimposed over the best fit (red curve) obtained from the structural model shown in Figure 2F. C) Comparison of the four distance distribution functions obtained using the program GNOM for CaM alone (grey), H:CaM (red), MLCK:CaM (cyan), and P454:CaM (green) complexes. D) DAMMIN models of CaM alone, H:CaM, MLCK:CaM, and P454:CaM complexes, shown with the same color code. E) Ten models fitting the SAXS curve shown on Figure 2B obtained using the program DADIMODO[ 68 ] are displayed after superimposition of Cαs over the range 10 to 70. F) Effects of P454 on the HDX behavior of CaM. The uptake differences (∆Deuteration) measured between the free‐ and P454‐bound CaM were extracted for each peptide at each time point, summed, and plotted on the best‐fitting structural model of P454:CaM (red curve in 2B). The summed ∆Deuteration values [Σ (∆Deuteration)] are colored from blue (no variation of deuterium uptake) to red (major reductions of deuterium uptake). Uncovered regions are in grey.
