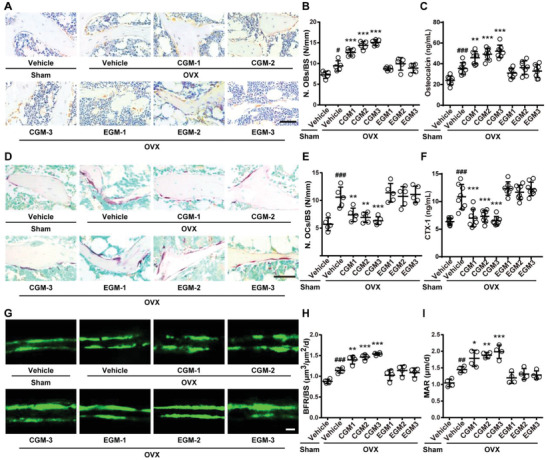
Figure 2.

CGM reverses the imbalanced bone metabolism in OVX mice. A) Representative OCN‐stained sections with quantification of the B) number of osteoblasts (N. OBs) on trabecular bone surface (BS) in distal femora from mice treated with vehicle or different donor‐derived CGM or EGM. n = 5 per group. Scale bar: 50 µm. C) ELISA for serum OCN. n = 7–8 per group. D) Representative TRAP‐stained sections with quantitation of the E) number of osteoclasts (N. OCs). n = 5 per group. Scale bar: 50 µm. F) ELISA for serum CTX‐I. n = 7–8 per group. G) Representative images of calcein double labeling with quantitation of H) bone formation rate per bone surface (BFR/BS) and I) mineral apposition rate (MAR). Scale bar: 10 µm. n = 4 per group. Data are presented as mean ± SD. # P < 0.05 versus Sham + Vehicle group and * P < 0.05 versus OVX + Vehicle group. #/* P < 0.05, ##/** P < 0.01, and ###/*** P < 0.001.
