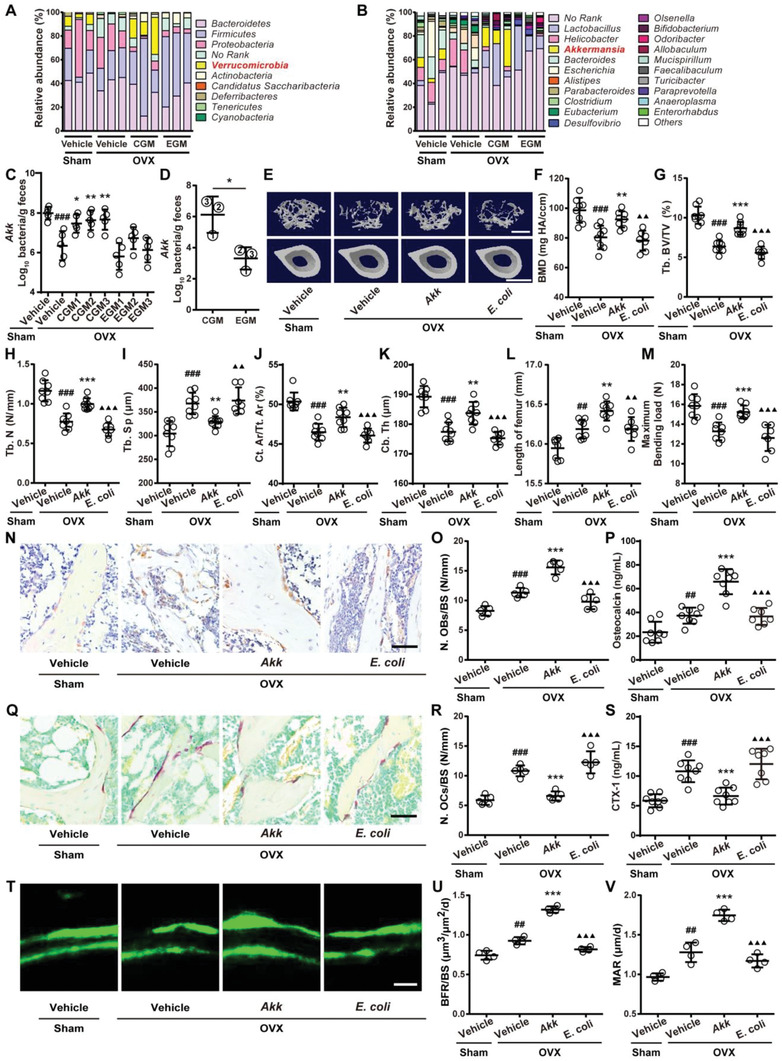
Figure 3.

CGM rescues the loss of gut Akk during osteoporosis and supplementation of Akk attenuates osteoporotic phenotypes in OVX mice. Composition of fecal microbiota at the A) phylum and B) genus levels tested by 16S rRNA gene sequencing. n = 3 per group. As for genus, the proportion <1% occupancy is noted as others. qRT‐PCR analysis of Akk abundance in fecal microbiota from C) Sham and OVX mice receiving different treatments (n = 5 per group), or from D) different CGM and EGM donors (n = 3 per group). E) Representative µCT images of trabecular (up) and cortical (bottom) bone in femora and quantification of F) BMD, G) Tb. BV/TV, H) Tb. N, I) Tb. Sp, J) Ct. Ar/Tt. Ar, and K) Ct. Th. Scale bars: 500 µm (up) and 1 mm (bottom). n = 7–8 per group. L) Lengths of femora. n = 7–8 per group. M) Femur ultimate load measured by three‐point bending test. n = 7–8 per group. N) Representative OCN‐stained sections with quantification of O) osteoblast number. Scale bar: 50 µm. n = 5 per group. P) ELISA for serum OCN. n = 7–8 per group. Q) Representative TRAP‐stained sections with quantification of R) osteoclast number. Scale bar: 50 µm. n = 5 per group. S) ELISA for serum CTX‐I. n = 7–8 per group. T) Representative images of calcein double labeling with quantitation of U) BFR/BS and V) MAR. Scale bar: 10 µm. n = 4 per group. Data are presented as mean ± SD. For panel (D): * P < 0.05 versus CGM group. For other dot plots: # P < 0.05 versus Sham + Vehicle group, * P < 0.05 versus OVX + Vehicle group, and ▲ P < 0.05 versus OVX + Akk group. * P < 0.05, ##/**/▲▲ P < 0.01, and ###/***/▲▲▲ P < 0.001.
