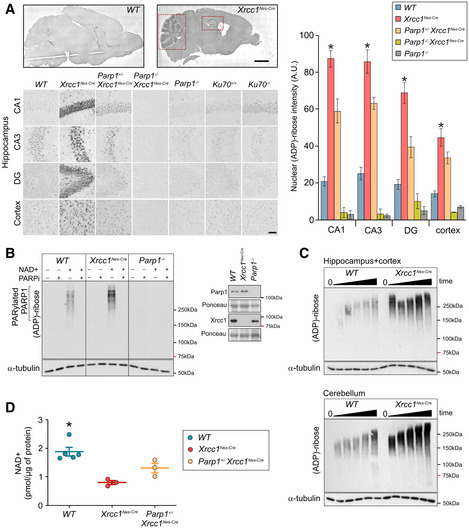
Sagittal sections obtained from mice (p15) of the indicated genotypes were immunostained for ADP‐ribose using the pan‐ADP‐ribose detection reagent MABE1016. Representative images showing levels of ADP‐ribose in the hippocampal regions CA1, CA3 and dentate gyrus (DG), and in the cerebral cortex. Red dotted boxes highlight the elevated ADP‐ribose staining in Xrcc1Nes‐Cre cerebellum (left dotted box) and hippocampus (right doted box). Scale bars: 5 mm, 50 μm. WT (n = 4 mice), Xrcc1Nes‐Cre (n = 4), Parp1+/‐ /Xrcc1Nes‐Cre (n = 4), Parp1−/−/Xrcc1Nes‐Cre (n = 3) and Parp1−/− (n = 3). Summary histograms show mean ± SEM. Pairwise comparisons between WT versus Xrcc1Nes‐Cre mice and WT versus Parp1−/−/Xrcc1Nes‐Cre mice were conducted by Kruskal–Wallis ANOVA with Dunn’s post hoc test, and statistically significant differences (*P < 0.05) are shown.
Protein extracts from wild‐type (WT), Xrcc1Nes‐Cre and Parp1−/− forebrain tissue, containing hippocampus and cortex, were incubated with 1 mM NAD+ for 45 min in the presence or absence of PARP inhibitor as indicated, and ADP‐ribosylation detected by Western blotting using the poly(ADP‐ribose)‐specific detection reagent MABE1031. Representative images from two or more independent experiments are shown. A Western blot showing the level of Parp1 and Xrcc1 in the forebrain tissue extracts is also shown, Inset.
Protein extracts from wild‐type (WT) and Xrcc1Nes‐Cre forebrain or cerebellum were incubated for 0, 5, 10, 15, 30 and 45 min in the presence of NAD+ as above.
NAD+ levels in wild‐type (WT), Xrcc1Nes‐Cre and Parp+/‐/Xrcc1Nes‐Cre forebrain tissue. Data are the scatterplots of individual measurements from at least three mice per genotype, with error bars representing the mean ± SEM. Statistically significant differences with Xrcc1Nes‐cre are indicated (Kruskal–Wallis ANOVA with Dunn’s post hoc test *P < 0.05).

