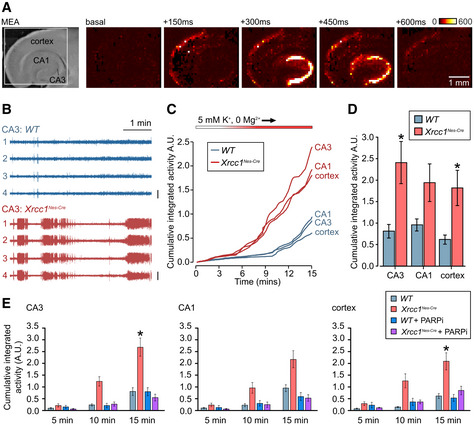
Brightfield image (left) of an acute brain slice positioned on HD‐MEA with targeted regions indicated. (Right) progression of a typical seizure event in a slice perfused with epileptogenic buffer; colour code indicates voltage changes in microvolts.
Representative traces from four channels in the CA3 region of hippocampus recorded from 10 to 15 min in epileptogenic buffer, showing seizure‐like activity in Xrcc1Nes‐Cre. Vertical scale bar indicates 300 μV.
Mean cumulative activity plots in CA1 and CA3 regions of hippocampus and cortex over 15 min of recording in epileptogenic buffer. WT (n = 8 slices from four mice), Xrcc1Nes‐Cre (n = 9 slices from four mice).
Summary histograms of the mean (± SEM) cumulative seizure‐like activity at 15 min, from the data in panel C. Statistical significance was assessed by ANOVA with post hoc pairwise comparisons (*P < 0.05).
Summary histograms (mean ± SEM) of cumulative seizure‐like activity at 5‐, 10‐ and 15‐min timepoints in cortex, CA1 and CA3 regions of wild‐type and Xrcc1Nes‐Cre brain slices from mice treated or not for 5–8 days ad libitum with PARP1 inhibitor (ABT‐888) prior to analysis. WT (n = 8 slices from four mice), Xrcc1Nes‐Cre (n = 10 from five mice), WT + PARPi (n = 6 from three mice) and Xrcc1Nes‐Cre + PARPi (n = 9 from three mice). Pairwise comparisons at the 15‐min timepoint between WT versus Xrcc1Nes‐Cre mice and WT versus Xrcc1Nes‐Cre mice + PARPi were conducted by Kruskal–Wallis with Dunn’s post hoc tests, and statistically significant differences (*P < 0.05) are shown.

