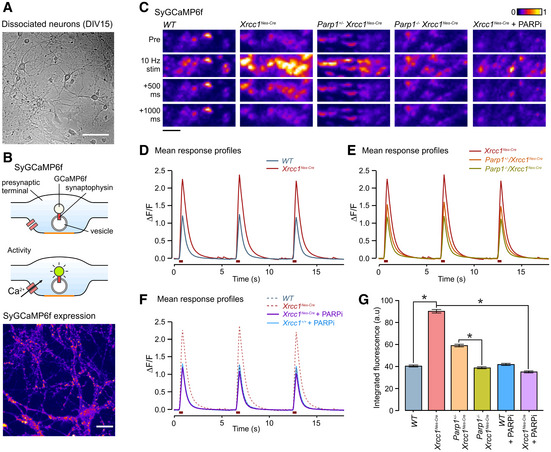
Figure 6. Aberrant presynaptic calcium signalling in Xrcc1−/− hippocampal neurons is rescued by Parp1 deletion or inhibition.

-
ARepresentative image of DIV15 dissociated cultured neurons used. Scale bar: 100 µm.
-
B(Top) Cartoon schematic illustrates SyGCaMP6f targeting and action. (Bottom) Image shows typical punctate SyGCaMP6f expression at DIV15. Scale bar, 20 µm.
-
CRepresentative images of fluorescence responses in synaptic terminals expressing SyGCaMP6f to a train of 10 stimuli at 10 Hz in dissociated hippocampal neurons derived from wild‐type and mutant mice. Scale bar: 5 µm.
-
D, EMean SyGCaMP6f responses to three rounds of 10 action potentials stimulation from mice of the following genotypes: WT (n = 1,946 synapses, nine coverslips, three animals), Xrcc1Nes‐Cre (n = 3,313, 12, 4), Parp1+/−/Xrcc1Nes‐Cre (n = 2,272, 9, 3) and Parp1−/−/Xrcc1Nes‐Cre (n = 2,122, 11, 3).
-
FResponse to chronic treatment with the PARP inhibitor, KU 0058948 Hydrochloride (1 µM) for 9–11 days prior to imaging for Xrcc1+/+ (n = 1,264 synapses, eight coverslips, three animals) and Xrcc1Nes‐Cre (n = 2,231, 10, 4) mice.
-
GSummary histogram of the mean (± SEM) of the integrated fluorescence responses for all individual synapses for each condition. Synapse number is the same as in (D–F). Responses are significantly higher in Xrcc1Nes‐Cre synapses versus both WT and Parp1−/−/Xrcc1Nes‐Cre (one‐way ANOVA, *P < 0.0033 and pairwise Student’s t‐tests).
Data information: (D–F) Data are from three or more independent experiments per genotype/treatment type, combined into one experimental data set and plotted on three separate graphs for clarity. Dashed lines in panels E and F are the WT and/or Xrcc1Nes‐Cre curves transposed from panel D for comparative purposes.
