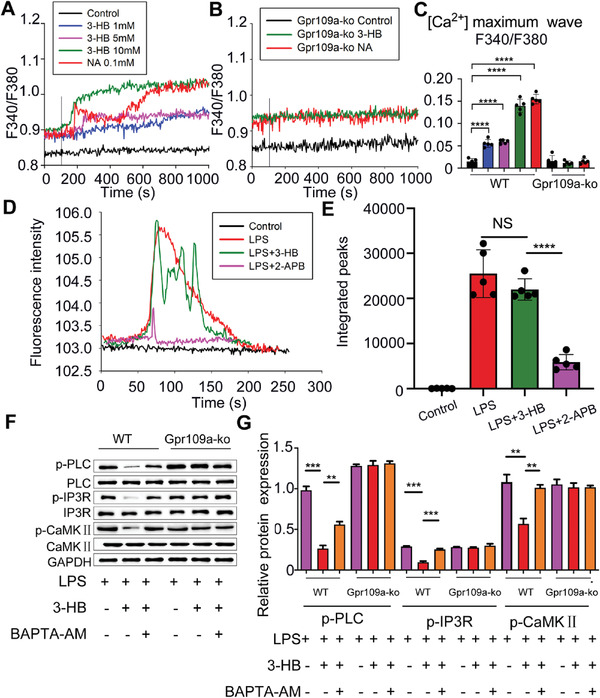
Figure 5.

3‐HB inhibits Ca2+ releasing from ER depended on 3‐HB–Gpr109a signaling‐activated Ca2+ influx. A,B) Change in cytosolic Ca2+ concentration in real time as detected by Fura‐2 fluorescence imaging. The isolated BMDMs from WT or Gpr109a −/− mice were loaded with Fura‐2 AM (10 × 10−6 m), and then perfused in Hank's buffer (with added Ca2+). 3‐HB (1 × 10⁻³, 5 × 10⁻³, and 10 × 10−3 m) or niacin (0.1 × 10⁻⁶ m) were added as indicated by the vertical lines in the Ca2+ tracings. C) Increases in intracellular Ca2+ concentration after the addition of 3‐HB (1 × 10⁻³, 5 ×10⁻³, and 10 × 10−3 m) or niacin (0.1 × 10⁻⁶ m) were calculated and plotted (n = 5). D) Change in cytosolic Ca2+ concentration in real time detected via Fluo‐4 fluorescence imaging. The isolated BMDMs from WT mice were loaded with Fluo‐4 AM (10 × 10−6 m), and then perfused in Hank's buffer (without addition of Ca2+). LPS (100 × 10−9 g mL−1), LPS (100 × 10−9 g mL−1) +3‐HB (10 × 10−3 m) or LPS (100 × 10−9 g mL−1) +2‐APB (100 × 10−6 m) were added as indicated using Ca2+ tracking. E) Increases in intracellular Ca2+ concentration after the addition of LPS (100 × 10−9 g mL−1) +3‐HB (10 × 10−3 m) or LPS (100 × 10−9 g mL−1) +2‐APB (100 × 10−6 m) (n = 5). F,G) Changes of phosphorylation levels of protein PLC, IP3R, and CaMKII in BMDMs treated with LPS (100 × 10−9 g mL−1) with or without 3‐HB (10 × 10−3 m) or the intracellular calcium chelater BAPTA‐AM (20 × 10−6 m). Data are presented as mean±SEM from at least three independent experiments, one‐way ANOVA. ** p <0.01, *** p <0.01, **** p <0.01; NS, no statistical significance.
